
Elegran Manhattan Market Update: May 2025
May 5, 2025
May 5, 2025
In a world rocked by macroeconomic volatility—from tariff turbulence to equity market swings—Manhattan’s residential real estate market delivered something far more impressive in April: stability. While headlines fixated on global uncertainty, Manhattan quietly returned to what many have been waiting years to see: a functional, balanced, and efficient market. As noted in Forbes last month, after years of both plentiful and constrained contract activity, Manhattan real estate is no longer lurching between extremes; it’s now operating at a measured, sustainable pace.
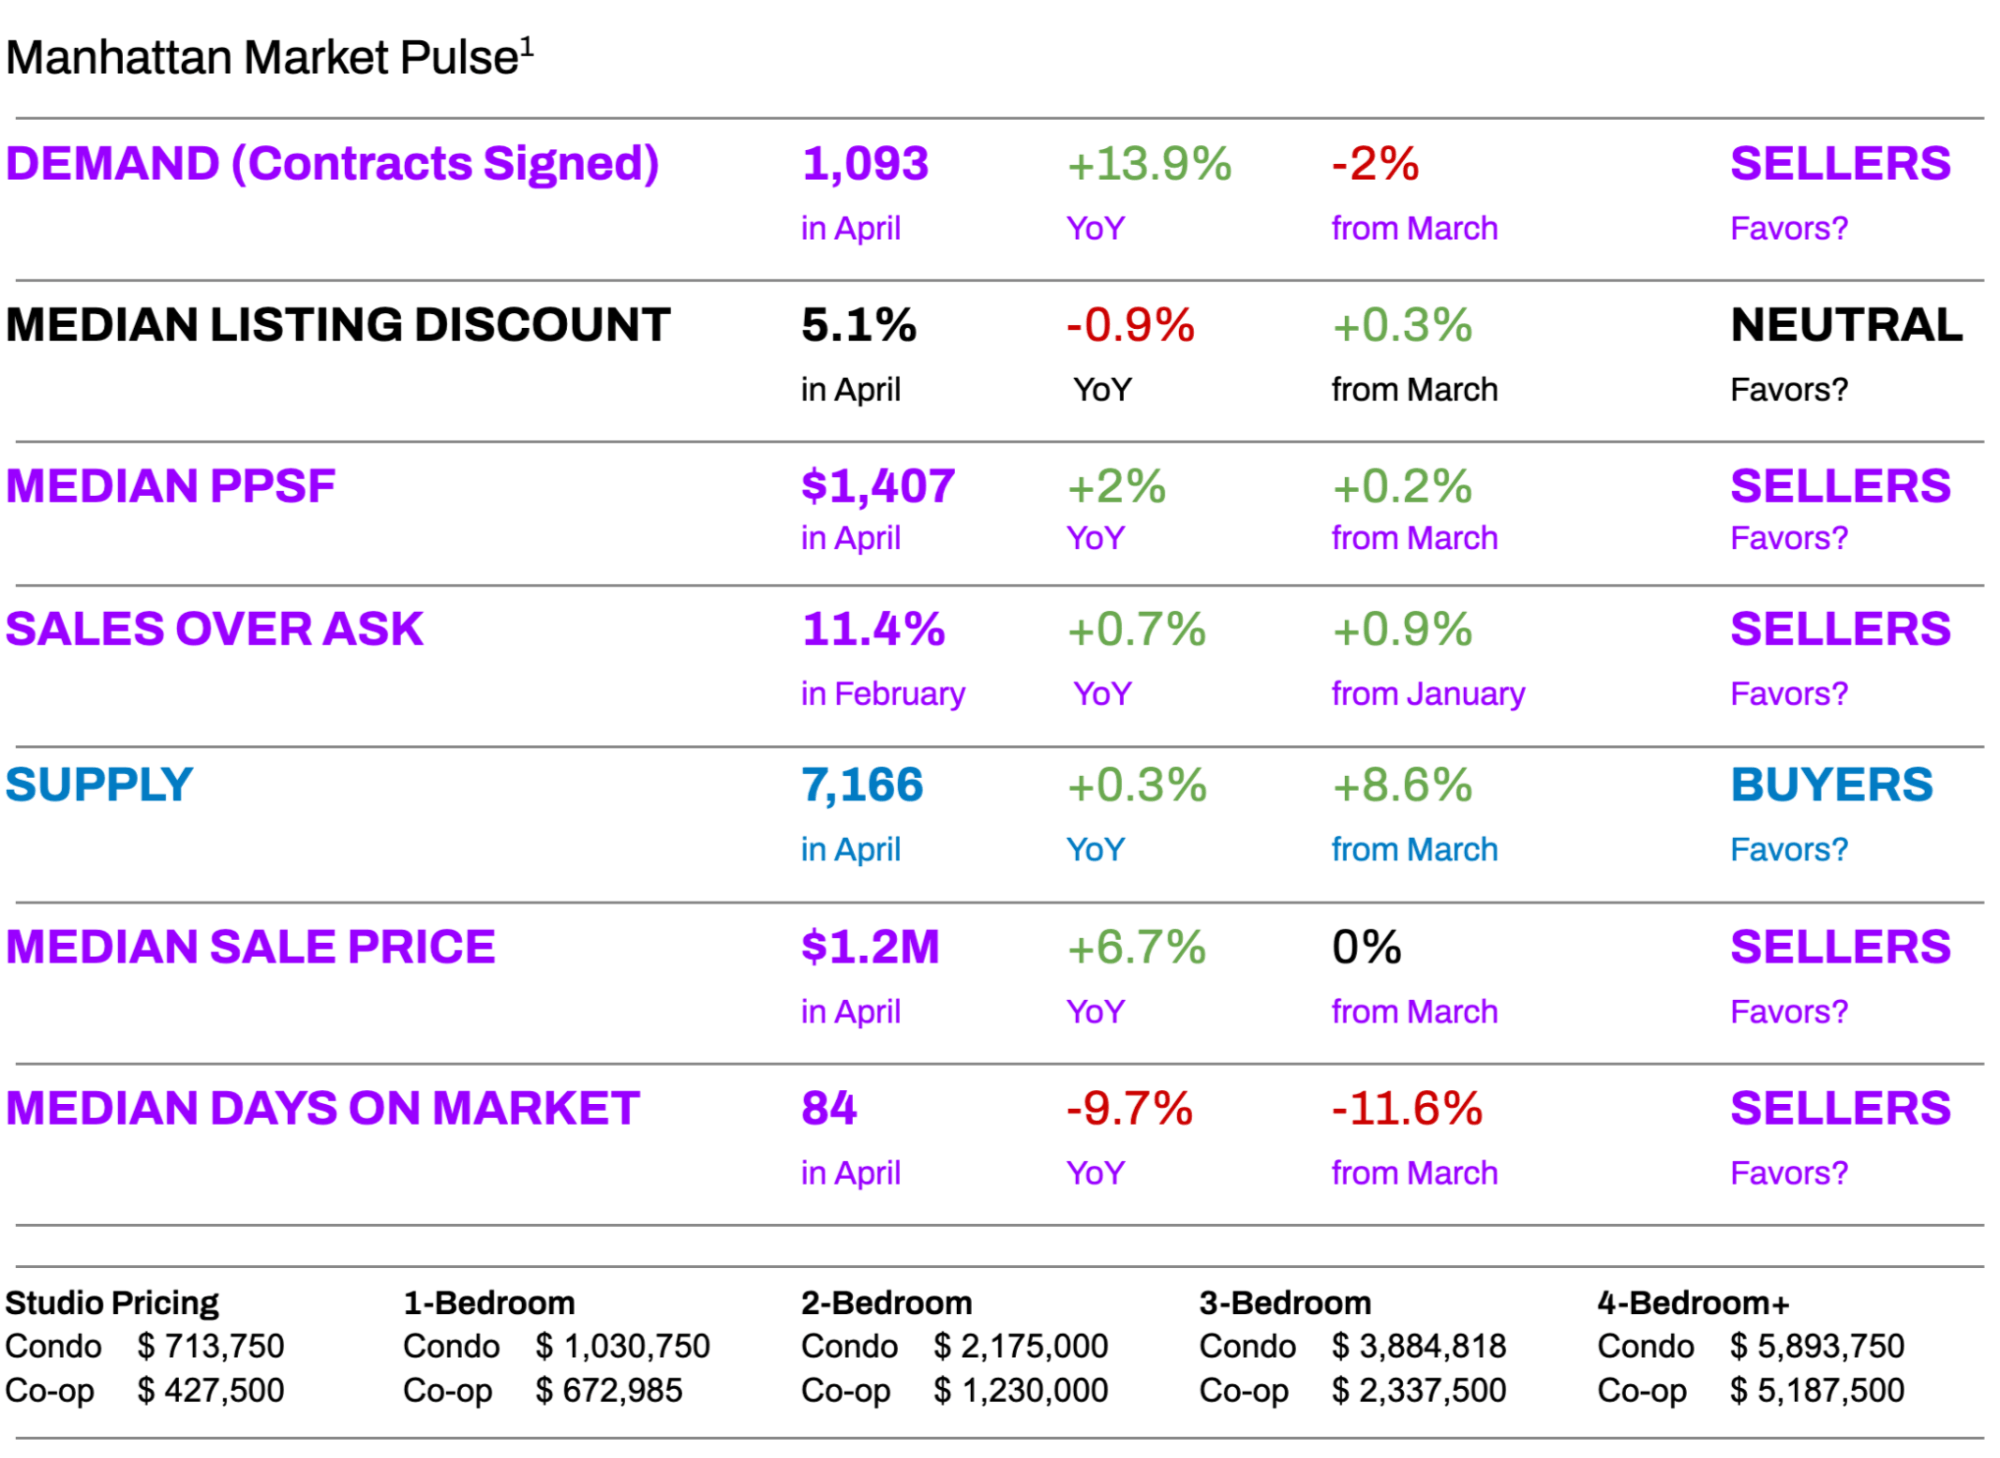
That sustainability was evident across the data. Despite temporary distractions from geopolitical noise and volatile interest rates, April produced a seasonally normal number of signed contracts—1,093 deals, just 2% below March but up a robust 14% year-over-year. For the first time in nearly a year, monthly deal volume aligned with historical norms. This surge in annual growth, even amid elevated mortgage rates, suggests that buyers are no longer driven by fear or speculation—they’re acting with clarity and purpose. The shift to necessity-based decision-making is helping fuel steady market activity even as borrowing costs remain elevated.
Inventory climbed 8.6% month-over-month to 7,166 active listings, giving buyers more options than they’ve had in recent months, but not enough to change the balance of power. The market remains relatively tight, especially in prime neighborhoods and among units priced below $ 2.5 M. That said, savvy buyers can find opportunity among listings that have lingered on the market for 45+ days. For sellers, the takeaway is clear: this is not a market that rewards aspirational pricing. Precision and presentation matter now more than ever.
The Elegran | Forbes Global Properties Manhattan Leverage Index², which factors in supply, demand, pricing, and listing discounts, showed a market walking the tightrope of equilibrium. Listing discounts nudged up slightly to 5.1%, but remain down year-over-year, signaling a market that still, albeit slightly, favors sellers, just less aggressively than in prior months. Meanwhile, 11.4% of properties sold above ask in April, reinforcing the two-speed nature of today’s market: compelling homes priced correctly are moving fast and, in some cases, competitively.
On the pricing front, Manhattan crossed a major milestone: the median price per square foot hit $1,407, breaking through the eight-year price ceiling set in 2016. This 0.2% monthly and 2% annual gain may seem modest, but it’s meaningful. The market is beginning to appreciate gradually and sustainably, a sign of long-term health. In a high-rate environment, stability is the story.
The rental market echoed this resilience. March median rent fell just 0.1% month-over-month to $4,495, but remains up 9.6% annually, with net effective rent tying its all-time high. Leasing activity continues to be robust as many would-be buyers opt to rent amid rate uncertainty. For landlords, this is an opportune window to reset under-market leases; for renters, competition is heating up heading into summer.
Looking ahead, both buyers and sellers should act decisively in the next 4–6 weeks. May is typically the final month of spring’s momentum before the summer slowdown sets in. With stable pricing, growing inventory, and buyer activity holding firm, this window may offer the best combination of selection and opportunity for the rest of the season. In a market this efficient, success comes from knowing when to trust the fundamentals. And right now, those fundamentals look solid.
→ Read the full Forbes article: What’s Next for Manhattan Real Estate? Stability.
Elegran | Forbes Global Properties Manhattan Leverage Index
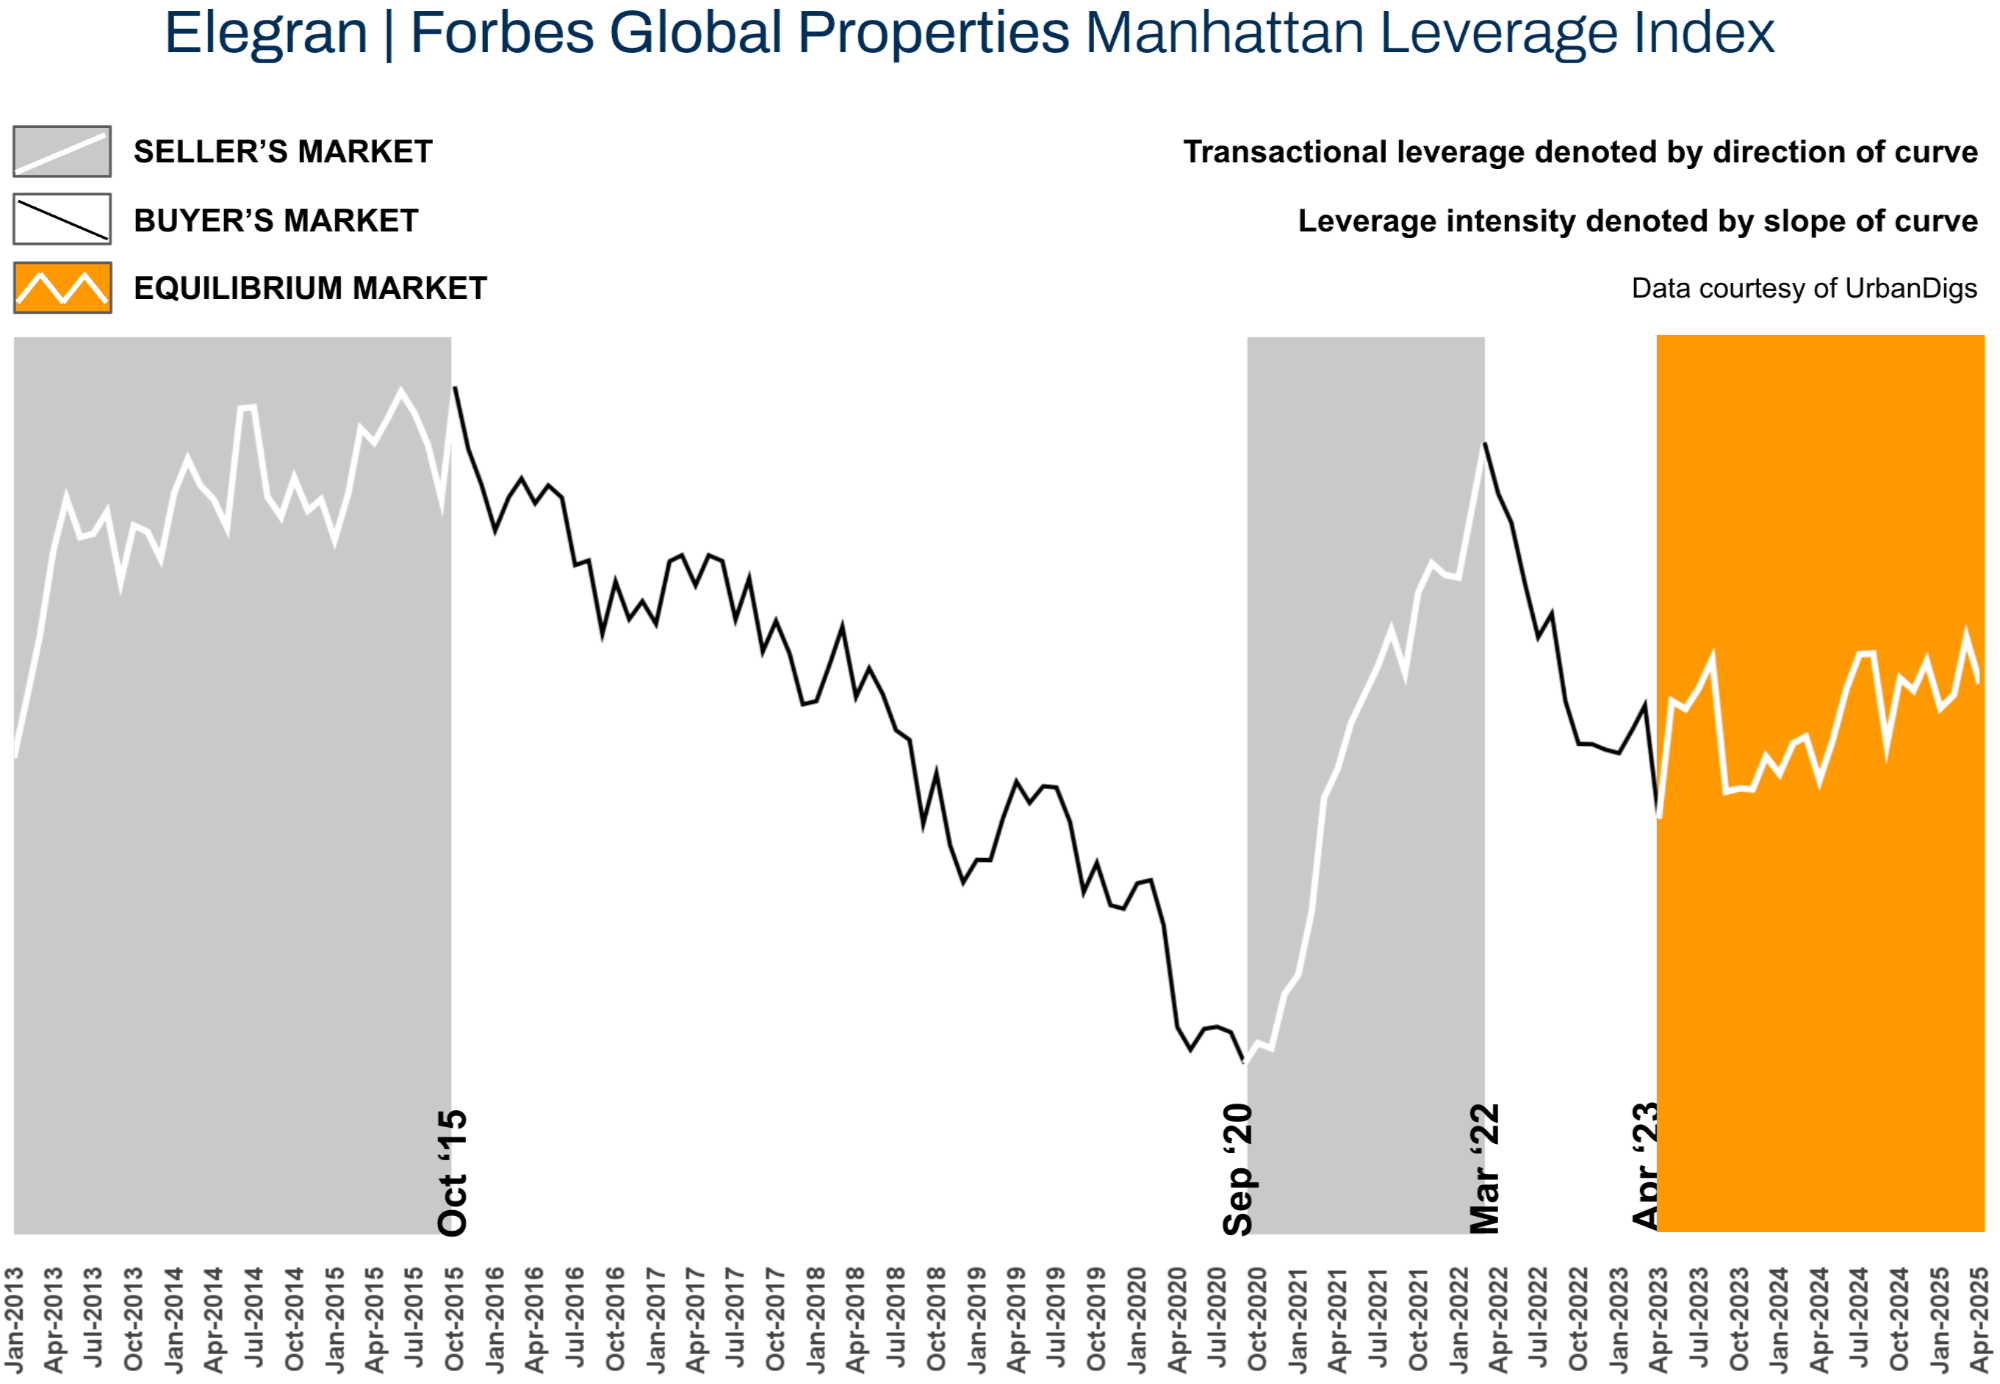
The Elegran | Forbes Global Properties Manhattan Leverage Index is powered by four indicators: supply, demand, median price per square foot (PPSF), and median listing discount.
It informs us whether the current market is a buyer’s or a seller’s, i.e., which party possesses transactional leverage. Looking at the graph below, this is indicated by the direction of the curve, where:
- An increasing trend from left to right indicates a seller’s market
- A decreasing trend from left to right indicates a buyer’s market
Our indicator also informs us regarding the relative strength of that leverage, indicated by the slope of the curve, where:
- A gentle slope indicates a weak advantage by one party over the other
- A sharp slope indicates a strong advantage
It’s not just the numbers that matter—it’s the direction of the trend. After five months of leaning toward sellers, Manhattan’s market softened slightly in April. Listing discounts crept up, and inventory ticked higher—subtle signs of a short-lived window for buyers. Still, this isn’t a full-scale power shift. The market remains finely balanced. Year-over-year data still favors sellers, even as month-over-month shifts hint at a very slight and temporary buyer’s edge—one that will likely vanish as seasonal demand gains steam.
Data & charts courtesy of UrbanDigs
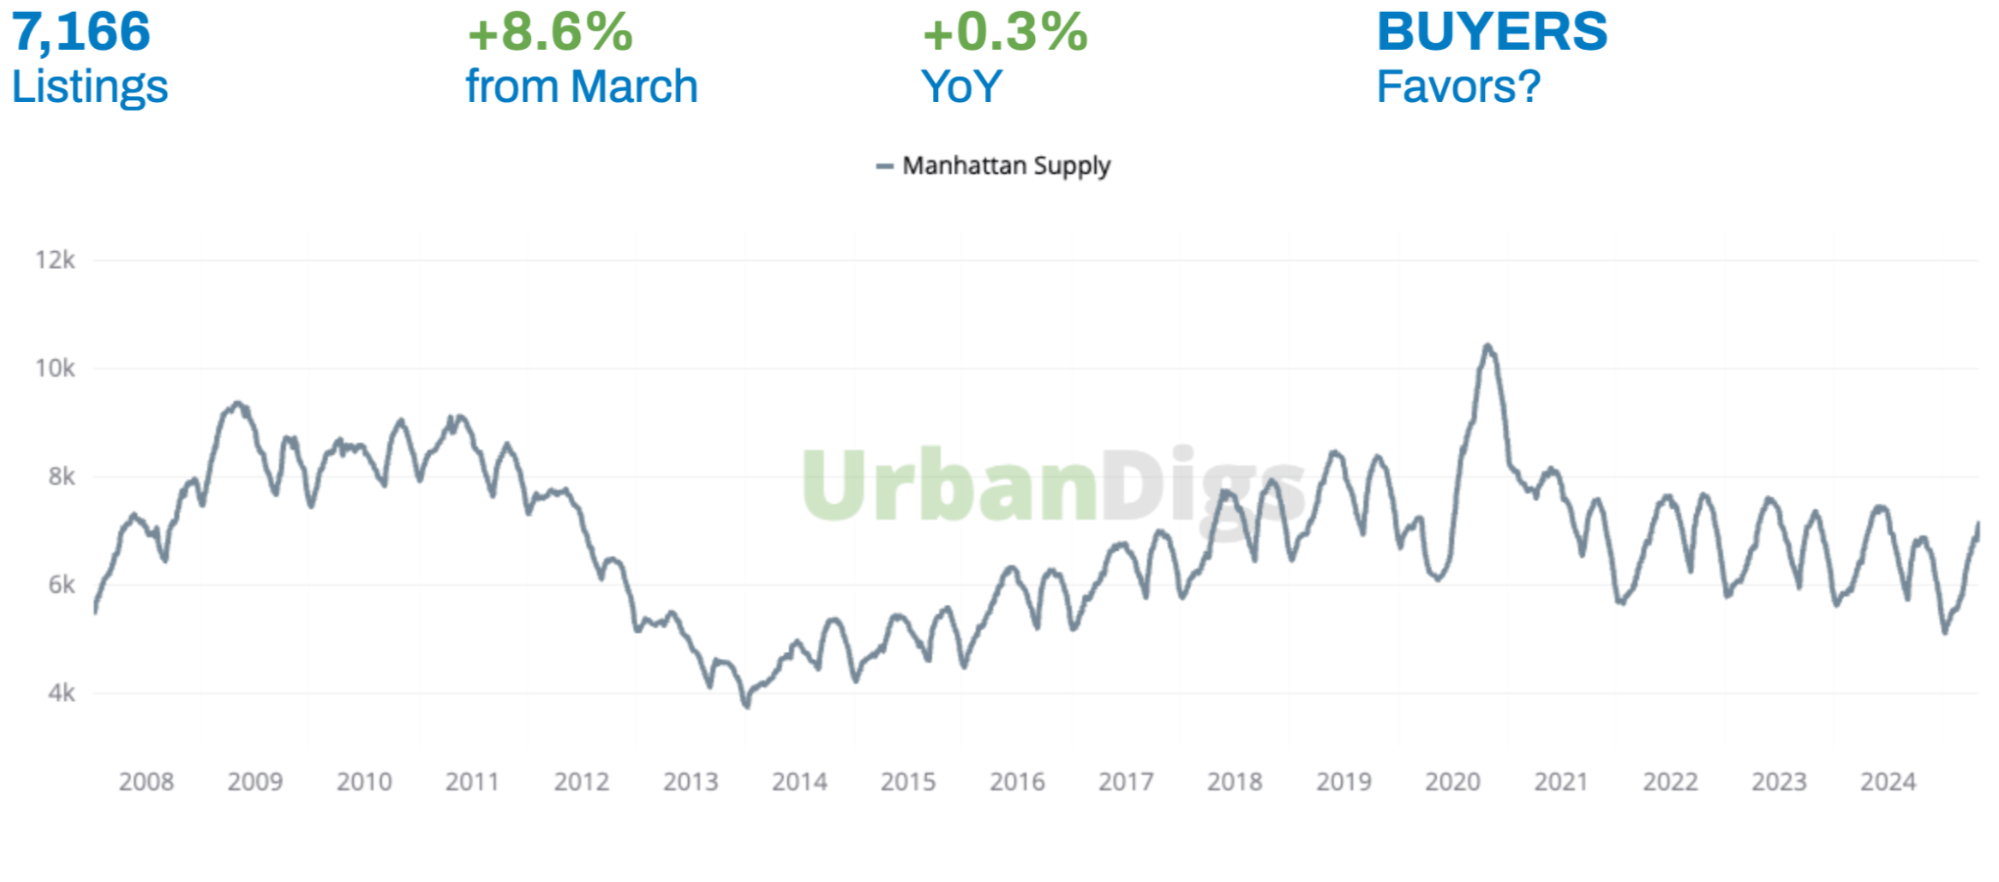
April marked a seasonal turning point as Manhattan’s residential inventory climbed to 7,166 units—an 8.6% jump from March and a slight 0.3% rise year over year. While this supply level mirrors the past two years, stronger demand in 2025 is creating a more competitive environment. Still, that competitiveness isn’t uniform—it varies significantly by property type, price point, and location.
What This Means for You:
BUYERS: More listings mean (slightly) more leverage, maybe. Segments that were inventory-starved earlier this year now offer breathing room, allowing you to be more selective. Trophy properties in top-tier locations still move fast, but there’s less pressure to chase imperfect listings. Pay special attention to properties on the market for 45+ days—these often signal motivated sellers and room to negotiate.
SELLERS: In a sea of 7,000+ listings, differentiation is everything. Buyers are moving quickly past anything that feels overpriced or not just right. To compete, your pricing, presentation, and positioning must be razor-sharp, especially in segments where buyer options are expanding.
Looking Ahead:
Inventory may continue to climb in May before tapering off in the summer. This creates a narrow but strategic window for buyers to act while selection is strong. By late June, choices may contract again, making the next 4–6 weeks the optimal time to engage.
Data courtesy of UrbanDigs
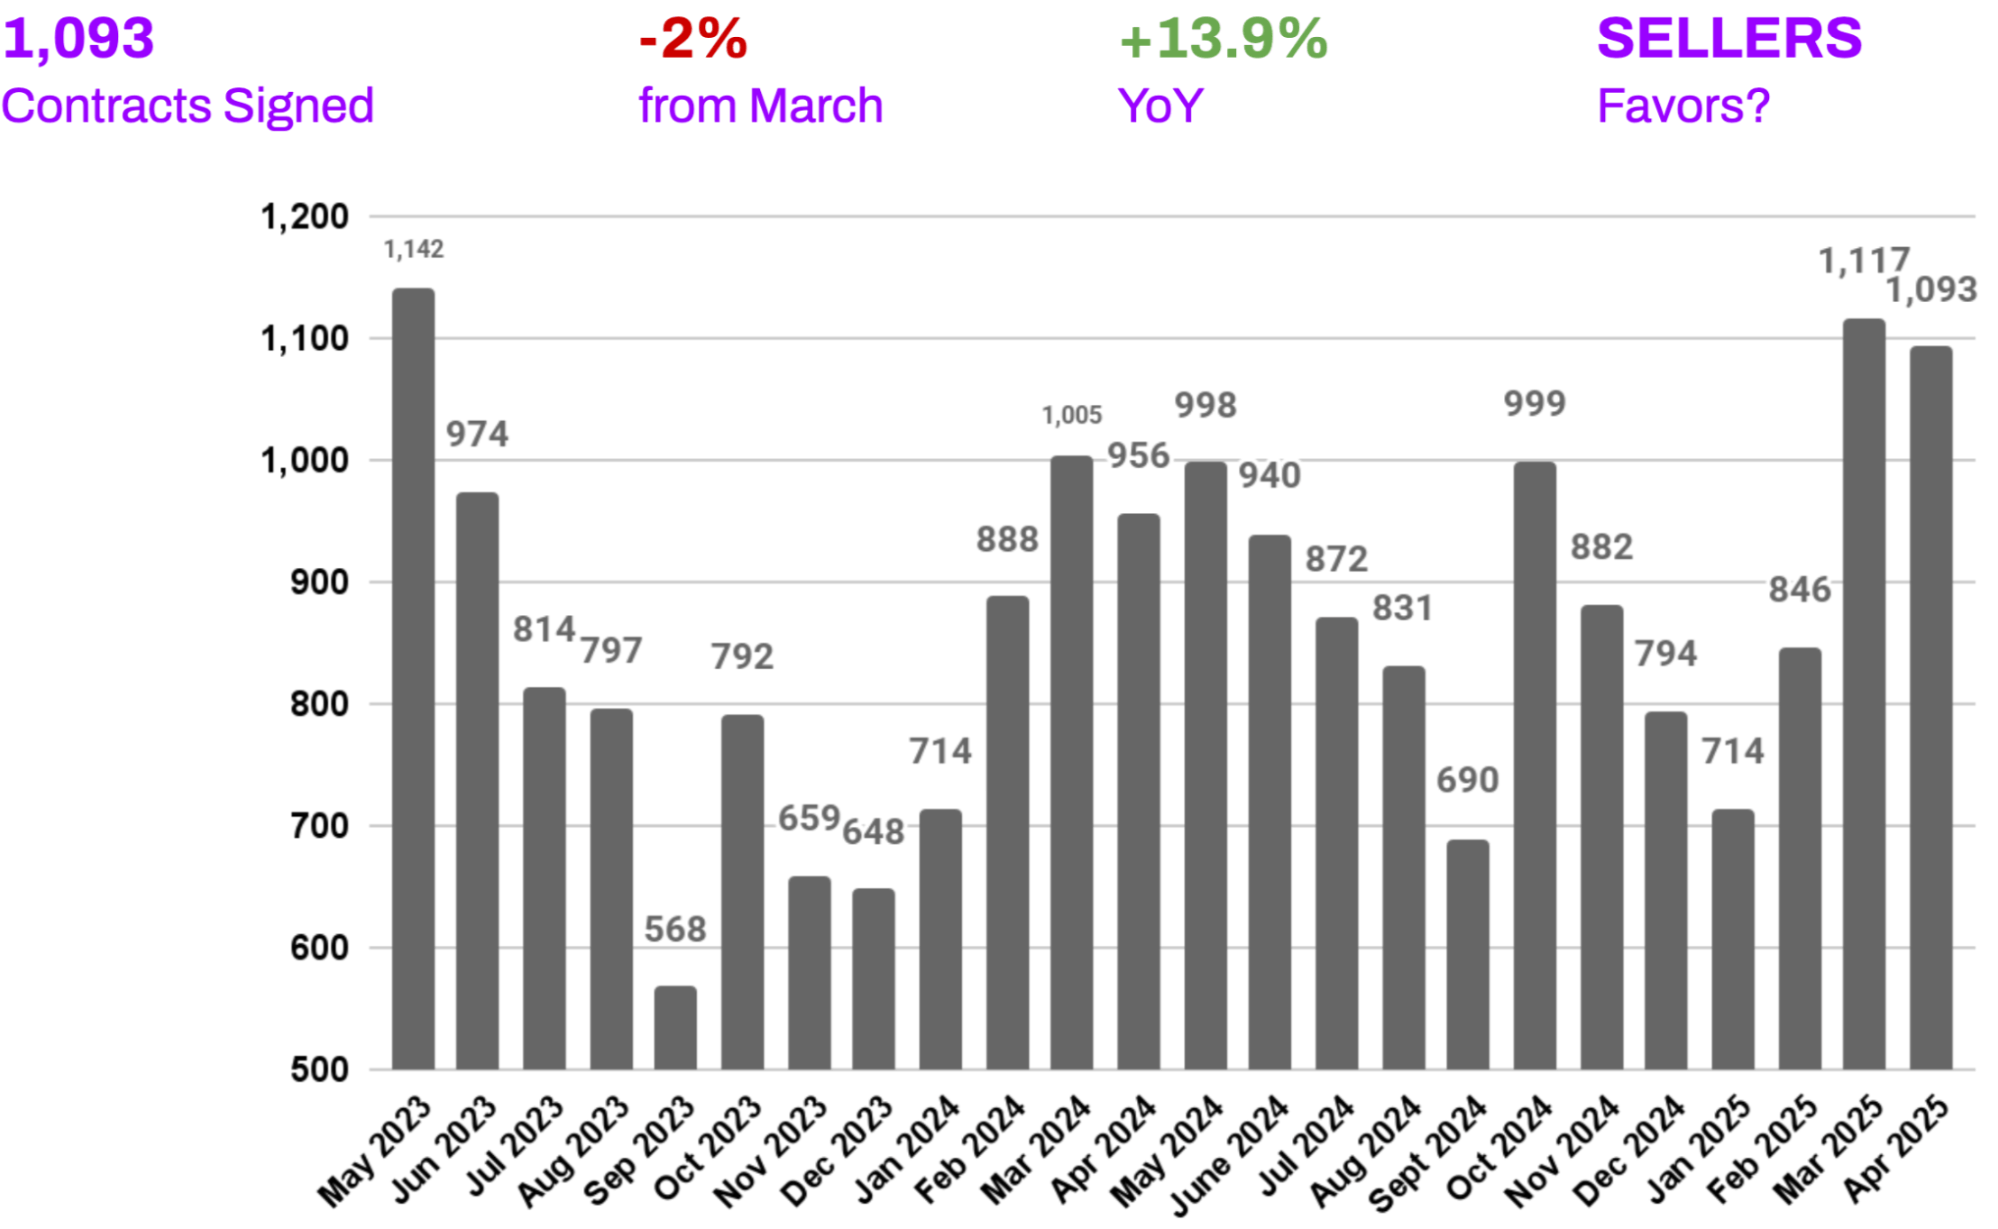
After strong momentum in February and March, Manhattan’s residential market saw a modest 2% month-over-month dip in signed contracts in April. This slight pullback aligns with seasonal norms—April often sees a small lull before activity picks up again in May. Layer in some macroeconomic noise—tariff tensions, equity market volatility—and it’s no surprise some buyers took a brief pause.
But don’t mistake this for a slowdown. April’s 1,093 signed contracts marked a 14% year-over-year increase, bringing activity in line with seasonal averages for the first time in months. That’s a signal of recovery and renewed confidence.
What makes this moment particularly telling is how buyers are behaving. Gone are the fear-of-missing-out-based bidding wars of 2021–2022. Today’s buyers are measured, strategic, and increasingly patient. They’re weighing options, comparing comps, and making thoughtful offers. That signifies a healthy, functioning market, not one driven by panic or scarcity.
What This Means for You:
BUYERS: The slight dip in activity offers a tactical edge—fewer competing offers, more room to negotiate, especially on listings that don’t spark immediate demand. But timing is key: desirable homes in great locations still command outsize attention. Use this moment to act decisively where it counts.
SELLERS: Despite the month-over-month dip, the bigger picture remains bright. A 14% annual gain confirms that demand is real and rising. But success still depends on precision. If your home isn’t generating strong interest in the first two weeks, a strategic price adjustment may be warranted.
Looking Ahead:
Expect steady contract activity through May, with a typical seasonal slowdown beginning in June. For sellers, now is the time to list, while demand is strong and inventory hasn’t yet peaked. For buyers, the next 4–6 weeks may present the best combination of choice and leverage before summer sets in.
Data & chart courtesy of UrbanDigs
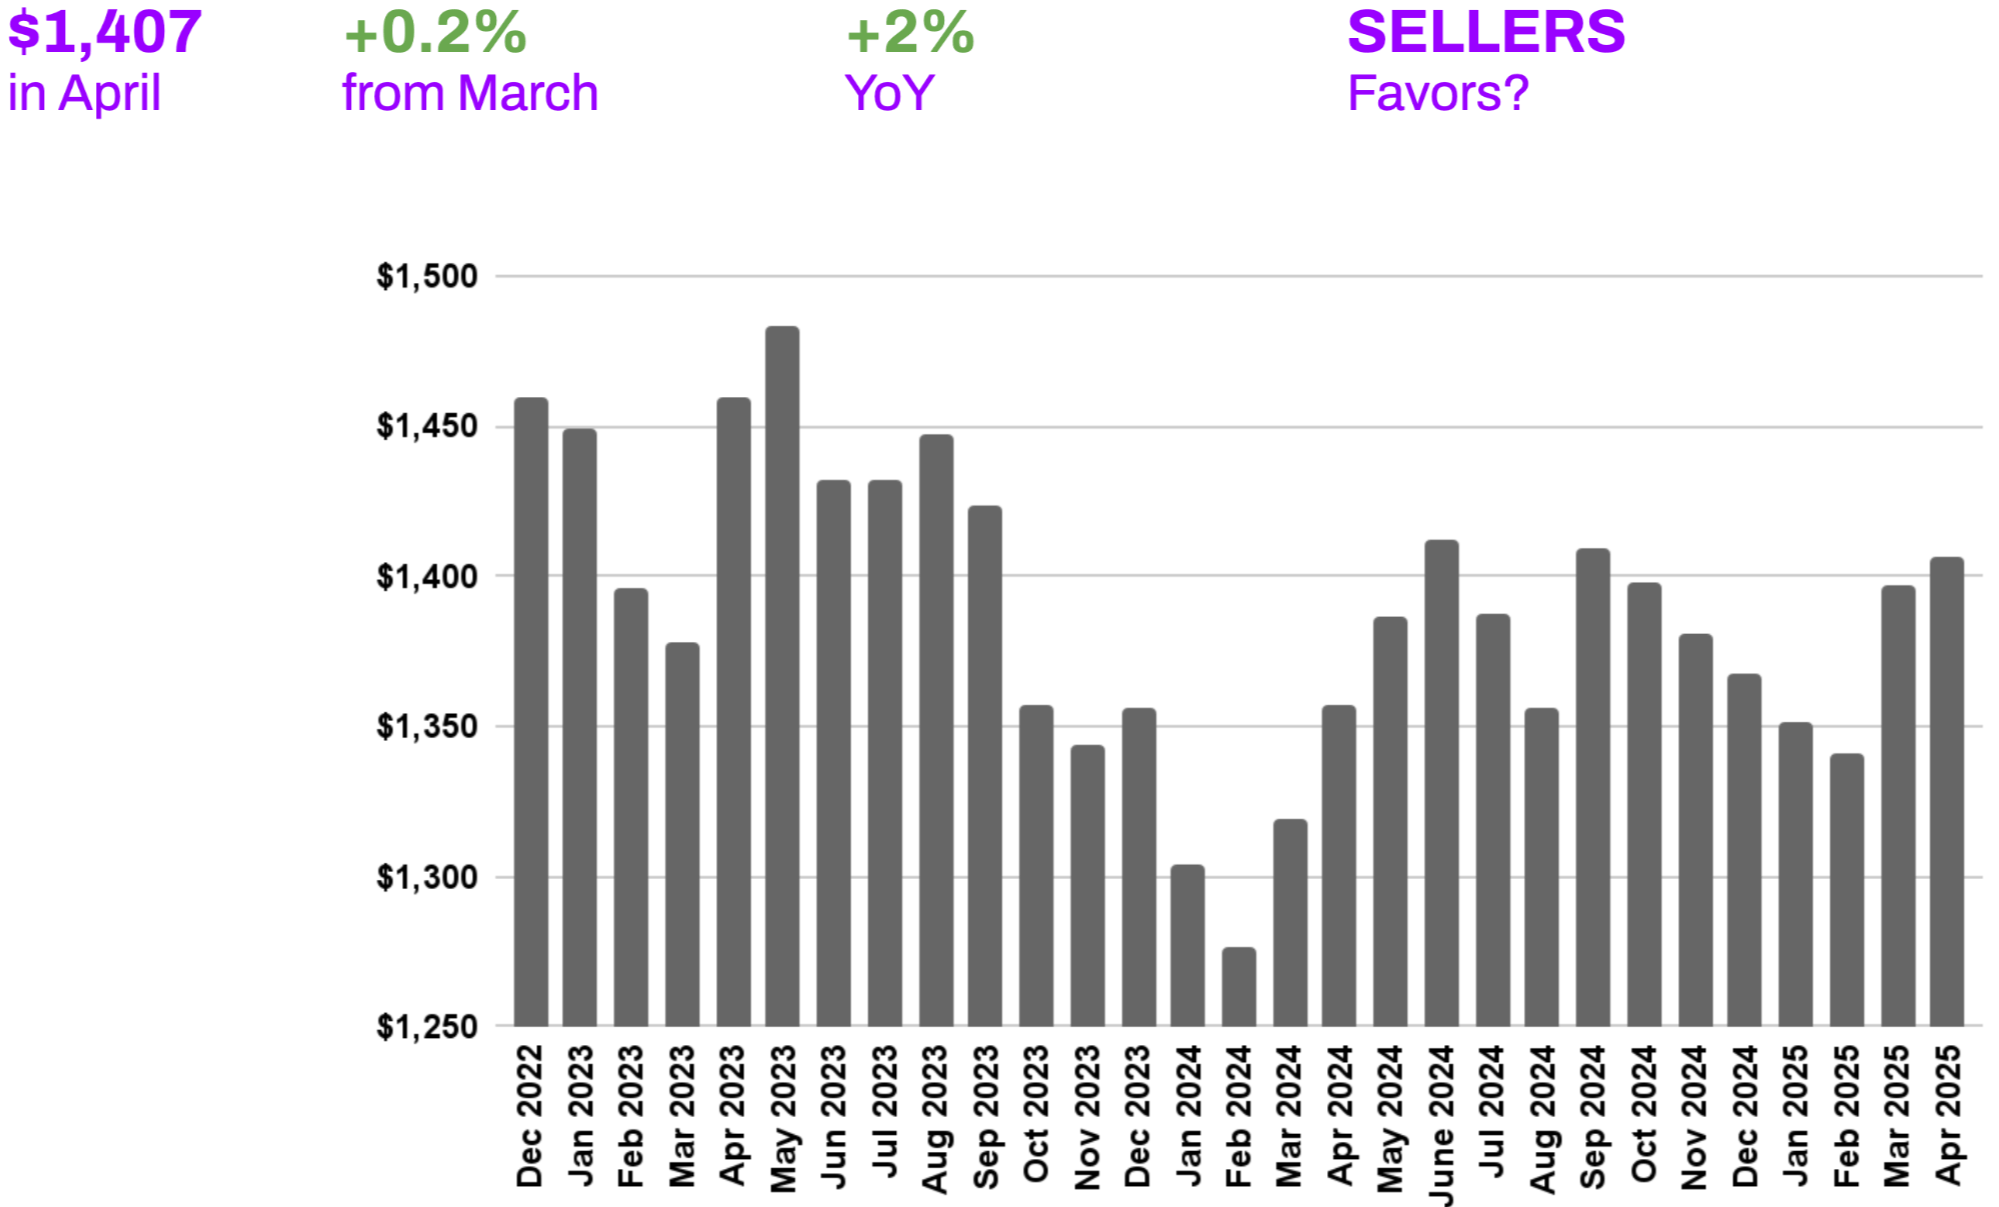
Manhattan’s median price per square foot rose to $1,407 in April, a 0.2% monthly gain and a 2% increase year over year—but more significantly, setting a new record high and officially breaking through the price ceiling that has held since 2016.
This isn’t just seasonal strength—it’s a signal of renewed buyer conviction and a market regaining pricing power. Buyers are paying premiums despite elevated mortgage rates, especially for quality inventory in prime locations. And unlike the volatility of recent years, this growth is deliberate, stable, and sustainable.
The market is no longer rebounding—it’s progressing. These steady gains represent long-awaited appreciation and reflect Manhattan’s return to form as a “blue-chip” real estate market.
What This Means for You:
BUYERS: Prices are rising—slowly but surely. With Manhattan finally breaking past its eight-year price ceiling, the longer you wait, the more expensive square footage becomes. If a property meets your criteria, the current trajectory suggests that acting sooner is the smarter financial move.
SELLERS: You’re no longer negotiating from a place of recovery—you’re operating in a record-setting market. That said, buyers are discerning. Properties priced based on fresh comps, whose prices are aligned with current conditions, are more likely to sell swiftly. Overpricing continues to result in stagnation.
Looking Ahead:
If trends hold, expect continued appreciation through late spring, particularly in more in-demand segments like one- and two-bed condos in top neighborhoods. For sellers, the next 8–10 weeks may offer the strongest pricing environment in nearly a decade, making this a strategic moment to list and capitalize.
Data courtesy of UrbanDigs
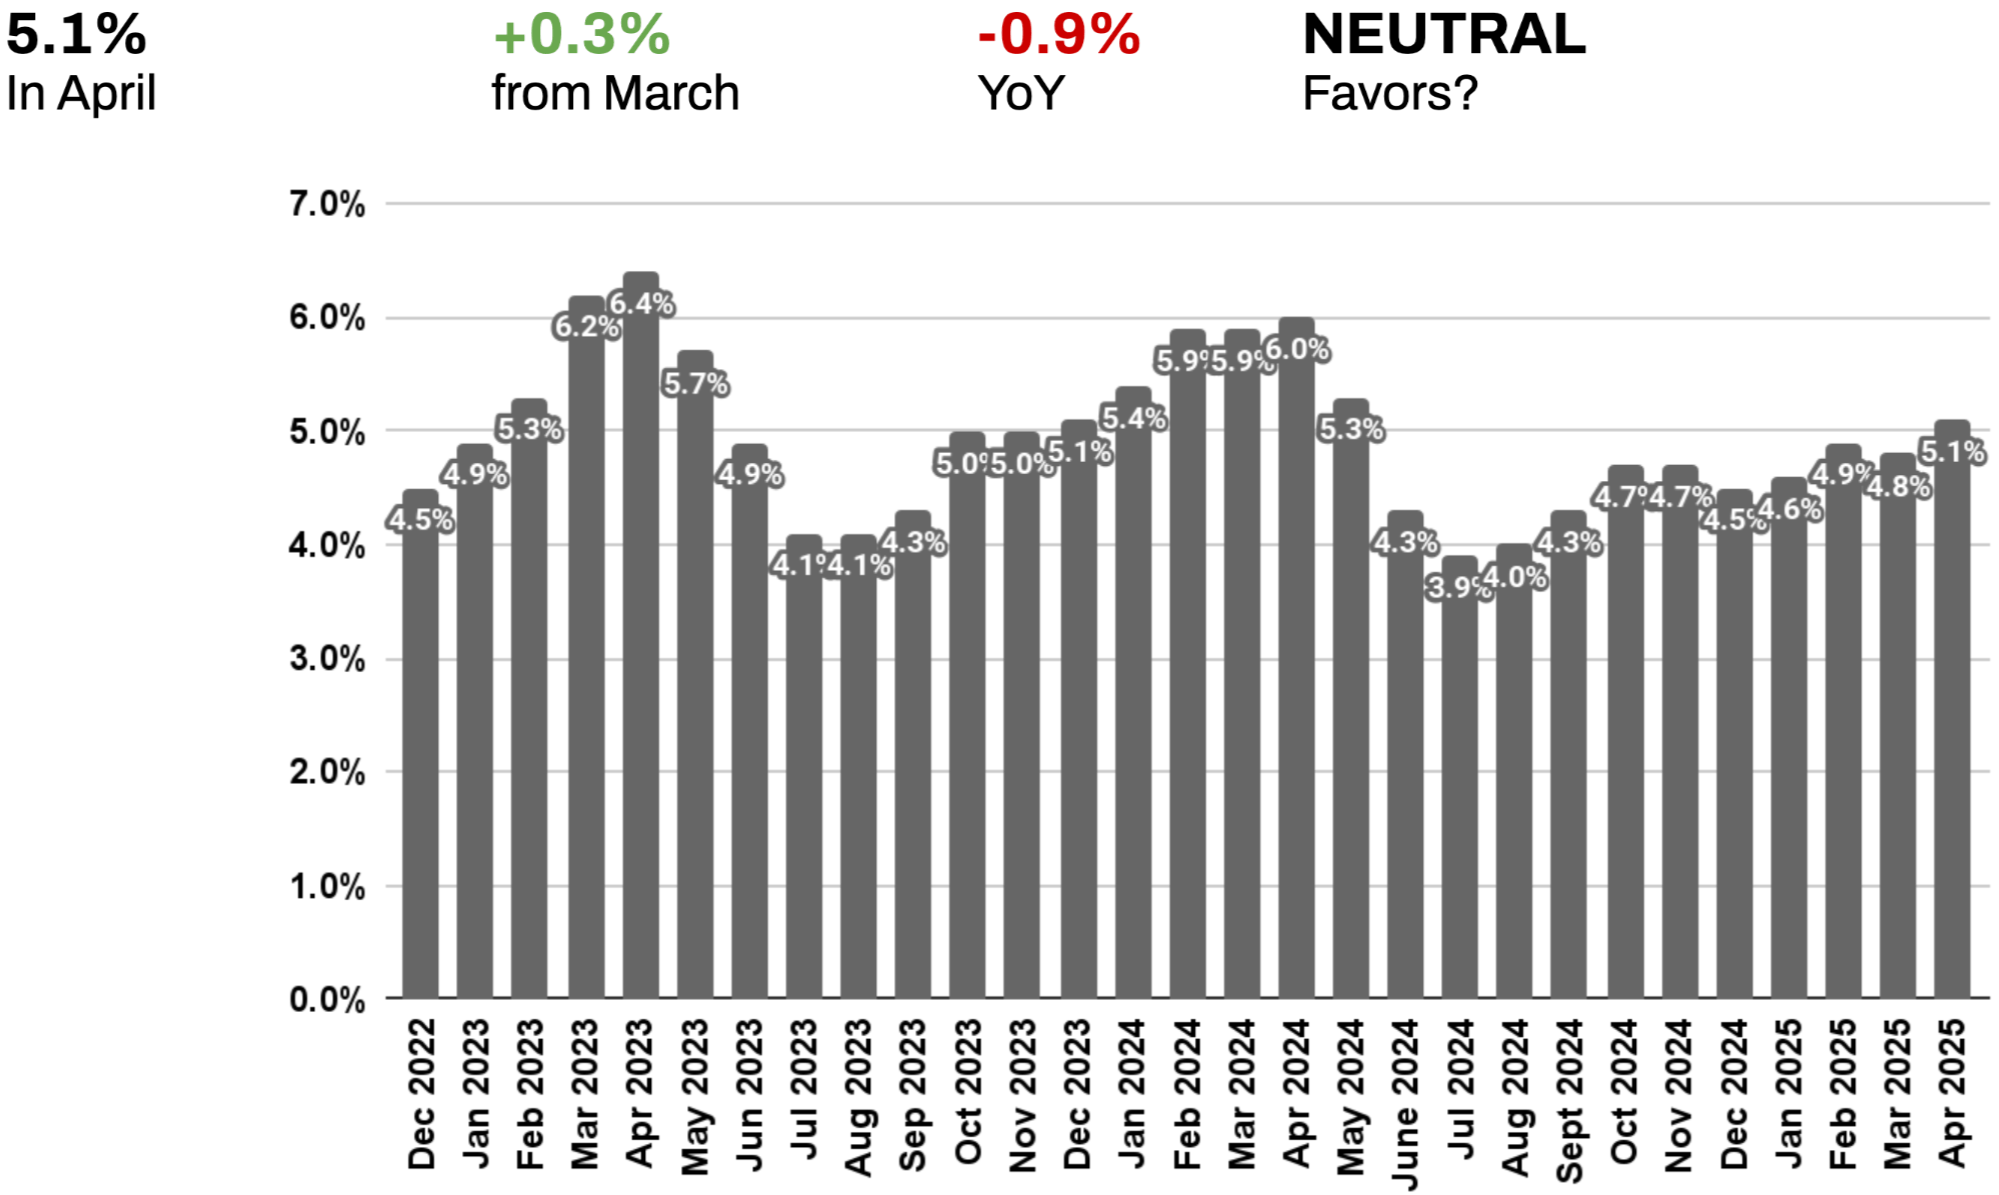
In April, Manhattan’s median listing discount ticked up to 5.1%, a 0.3% month-over-month increase. This modest rise offers buyers slightly more room to negotiate, but the bigger picture tells a story of tightening efficiency. Compared to a year ago, listing discounts are down 0.9%, reflecting stronger alignment between sellers’ expectations and buyer willingness to pay.
This subtle shift comes as inventory expands mid-spring, granting buyers more options—but not necessarily more discounts. The negotiating window remains narrow, especially for move-in-ready homes in high-demand neighborhoods.
Adding to the complexity, 11.4% of properties sold above asking in April—a figure that’s up both monthly and annually. This reinforces a bifurcated market: well-priced, well-positioned homes attract bidding wars, while mispriced listings linger and eventually require price cuts.
What This Means for You:
BUYERS: The increase in listing discounts creates targeted opportunities, not widespread bargains. Focus your attention on listings that have:
These are your best bets for meaningful negotiation. But for premium properties in tight inventory segments, expect little room to negotiate, and possibly a bidding war driving the price above the asking price.
SELLERS: This is a market that rewards precision and penalizes overreach. Homes priced within 3–5% of market value sell swiftly, often with minimal discounting. If your property has been listed for more than 30 days without serious interest, it may be time to recalibrate your pricing. Aspirational pricing is increasingly met with silence.
Looking Ahead:
The slight rise in listing discounts appears tied to the seasonal rise in inventory, not a weakening of demand. As motivated sellers transact and inventory levels normalize, expect discounts to stabilize—or tighten—by summer. For buyers, this moment presents a narrow window to negotiate before market efficiency firms back up.
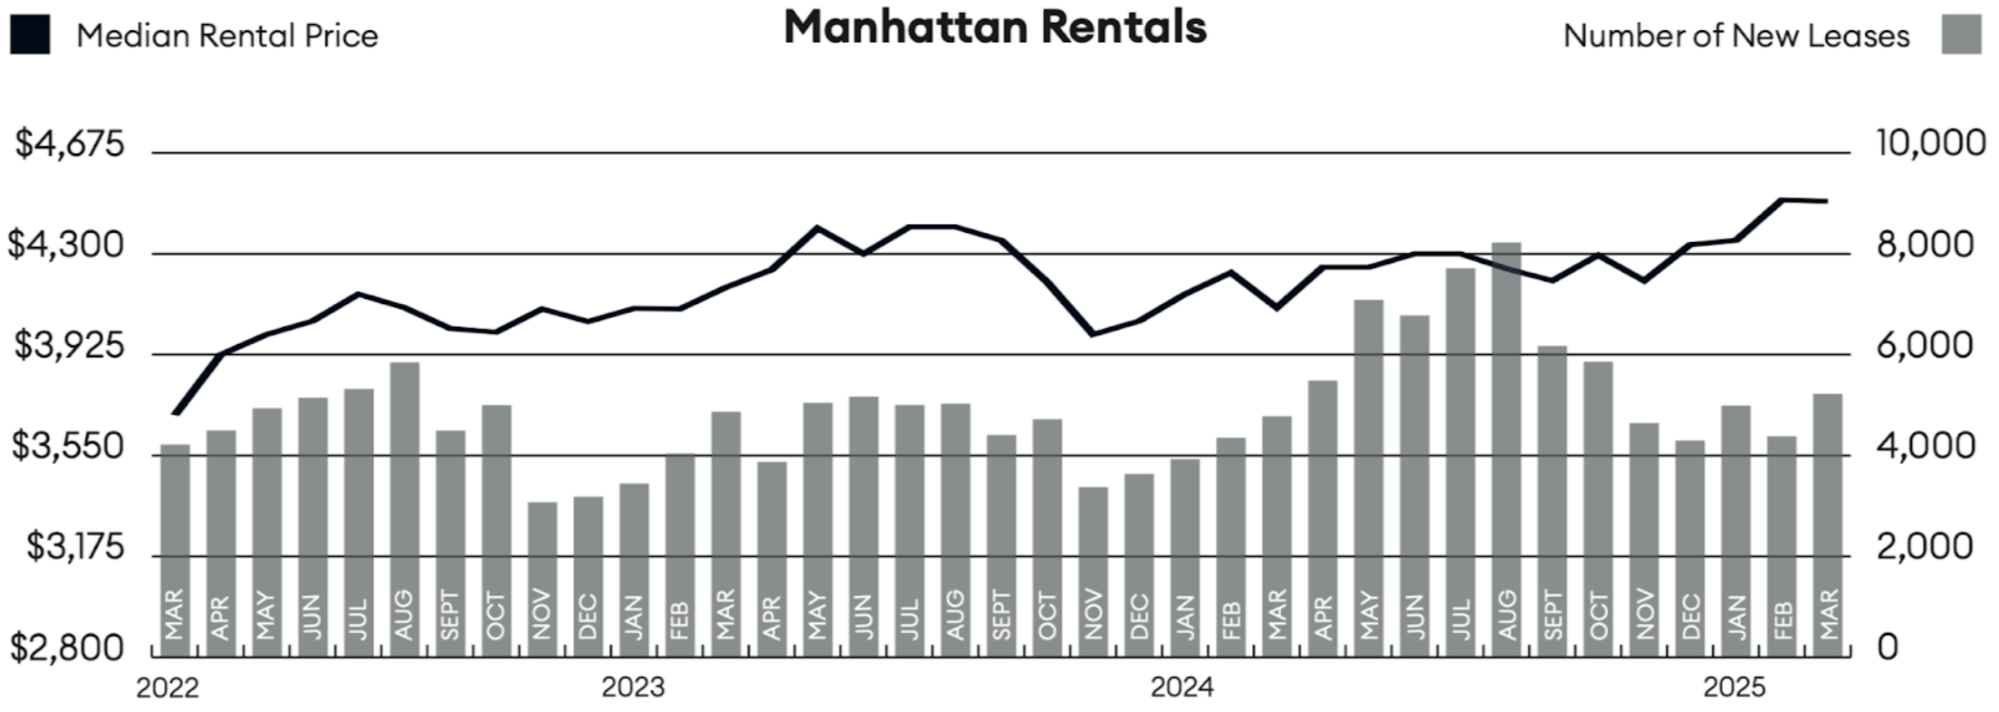
Chart courtesy of Miller Samuel, Inc.
In March 2025, Manhattan’s median rent edged down just 0.1% to $4,495. But don’t mistake that for softening—rents are still up 9.6% year-over-year, and median net effective rent tied its all-time high, marking the sixth consecutive annual increase. New lease signings also surged, nearly doubling levels seen five years ago during the early days of COVID.³
This seeming paradox—a tiny monthly dip alongside record-breaking annual gains—speaks to the rental market’s resilience. Despite seasonal cooling and a wave of new development completions, demand remains relentless. Strong employment figures, population stickiness, and elevated mortgage rates continue to steer many would-be buyers toward renting, reinforcing pressure on pricing.
Simply put: the fundamentals haven’t changed. Manhattan rents are hovering at historic highs—and not by accident.
What This Means for You:
RENTERS: To gain an advantage, expand your search to neighborhoods on the periphery of your target area, consider slightly older buildings with fewer amenities, and be prepared to act immediately when you find a suitable option. Having your documentation, credit check, and deposit ready before beginning your search can give you a critical edge.
LANDLORDS: Despite the microscopic month-over-month decrease, the market continues to favor property owners substantially. With net effective rents at historic highs and strong year-over-year growth, this remains an opportune time to adjust rental rates toward market value, particularly for renewing tenants who may be paying below current rates.
Looking Ahead:
Expect rental strength to persist through the summer, which is historically Manhattan’s peak leasing season. While year-over-year rent growth may moderate from today’s near-double-digit pace, upward pressure remains, especially in neighborhoods with limited new inventory in the pipeline. For both landlords and tenants, the next 90 days may be the most competitive of the year.
Mortgage Remarks
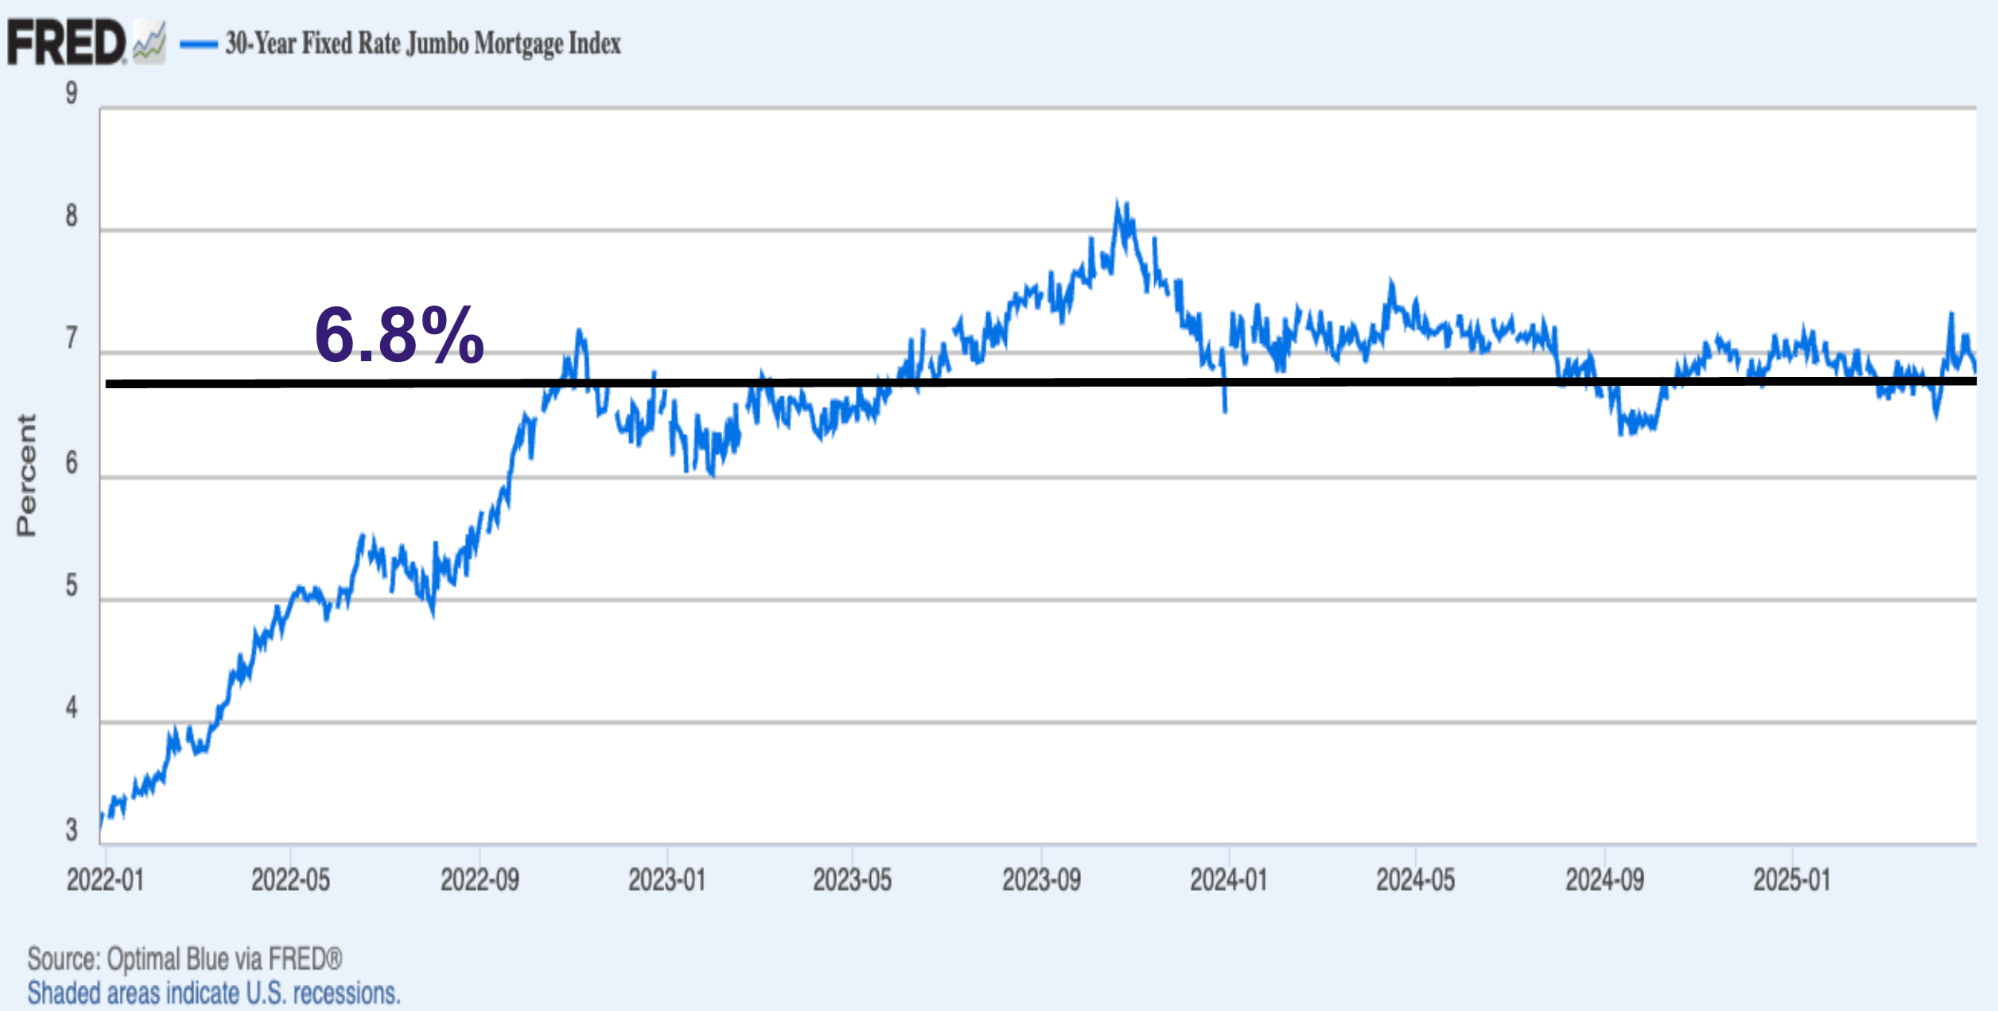
The 30-Year Fixed JUMBO Mortgage Index currently sits at 6.8%⁴, with an average APR of 6.4%⁵. Rates eased slightly in late April following their post-tariff spike, but remain above March levels, though still lower than the peaks of January and early February.
The prevailing view? Rates in the mid-6% range are the new normal. Barring a major economic shift, most experts expect this level to persist into 2026.
But here’s what’s changed: interest rates no longer dictate market behavior. Buyers and sellers have stopped waiting for a drop. Instead, they’re transacting based on life events, job changes, and long-term plans, marking a decisive shift from speculation to necessity.
This mindset reset is fueling steady transaction volume, even with elevated borrowing costs. The market is no longer paused—it’s progressing, with participants adapting to reality rather than resisting it.
The total return on real estate investments is driven by net rental income and capital appreciation. Manhattan cap rates are currently between 3% and 3.4% for all-cash investors. Unfortunately, investors using a large percentage of leverage face challenges in generating net income, given the average JUMBO mortgage APR of 6.4%. Timing and a strong USD may afford foreign investors, depending on their native currency, the opportunity to realize significant capital gains upon selling their assets.
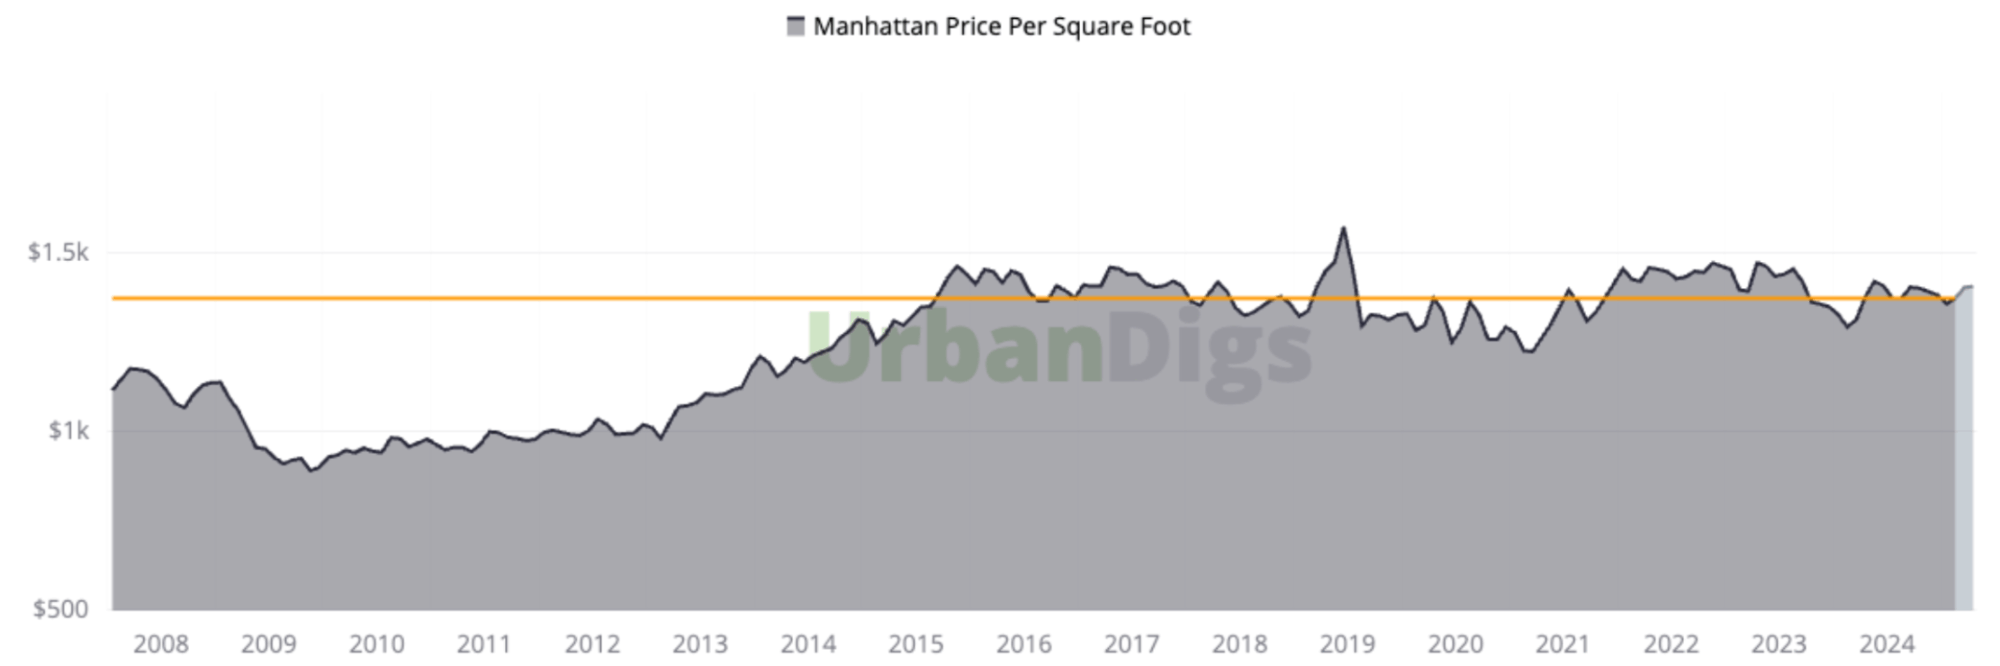
Chart courtesy of UrbanDigs and indicates Manhattan median PPSF as a function of the closed sale date. The light grey area to the extreme right indicates incomplete data,
and the orange line indicates the most recent median PPSF based on data considered complete.
1. Data courtesy of UrbanDigs
2. According to the Elegran | Forbes Global Properties Brooklyn Leverage Index
3. Data courtesy of Miller Samuel, Inc.
4. Data courtesy of Federal Reserve Bank of St. Louis
5. JUMBO mortgage rate APR data courtesy of Bank of America, Chase, and Wells Fargo
Her experience, expertise, and engaging personality make Sonal the perfect combination of advisor, advocate, and strategist. She is the proud owner of several NYC properties and a skilled negotiator with a deep understanding of people and sharp instincts about market trends.