Manhattan Market Pulse ¹ July 2026
Demand Climbs as Inventory Tightens Further
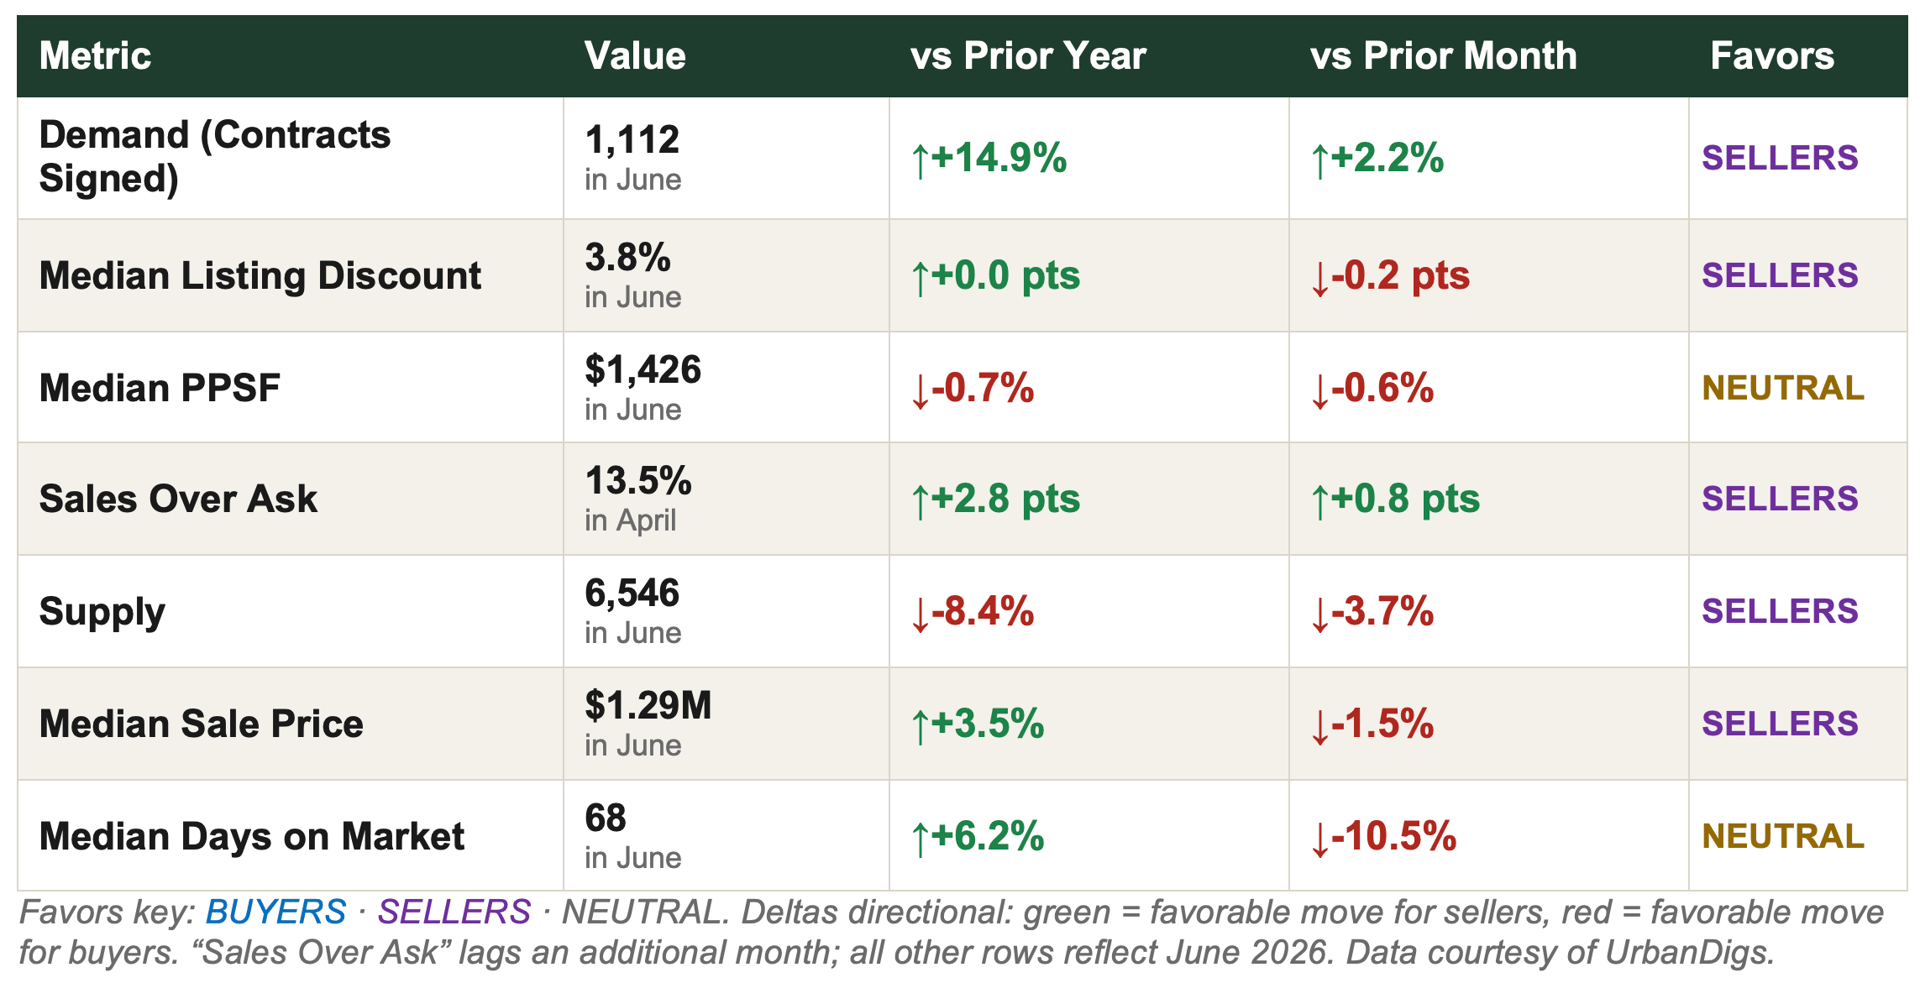
Manhattan’s spring momentum carried straight through June. Contracts signed climbed to 1,112 — up 14.9% year-over-year, the strongest annual demand gain in this report series — while active inventory tightened to 6,546 listings, now 8.4% below June 2025. The median sale price held at $1.29M, up 3.5% year-over-year, and the listing discount compressed to 3.8%, among the tightest readings of the past two years.
Bottom line: Manhattan enters the second half of summer firmly seller-leaning. Demand is accelerating on both a monthly and annual basis, supply is contracting rather than seasonally building, and negotiating room keeps shrinking. The one metric moving the other way — median price per square foot, essentially flat to slightly down — looks like transaction mix rather than a change in underlying pricing power.
Market Snapshot: Five Numbers That Matter
- 1,112 contracts signed in June — up 14.9% year-over-year and 2.2% from May. Demand is accelerating, not just holding.
- 6,546 active listings — down 8.4% year-over-year, even after a seasonal 3.7% pullback from an already-lean May count.
- $1.29M median sale price — up 3.5% year-over-year. Appreciation remains intact through the spring-to-summer transition.
- 3.8% median listing discount — among the tightest readings in two years, down further from an already-compressed May.
- 13.5% of April sales closed above asking price, up 2.8 points year-over-year — a clear read on where buyer competition is concentrated.
Key Takeaways
- Demand accelerated on both axes: contracts +2.2% MoM and +14.9% YoY to 1,112 — the strongest year-over-year reading this report has tracked recently.
- Supply keeps contracting: 6,546 active listings, down 8.4% YoY. Manhattan is not seeing the seasonal inventory build that would typically ease pressure on buyers.
- Pricing power is intact: median sale price $1.29M (+3.5% YoY); listing discount compressed to 3.8%, near multi-year lows.
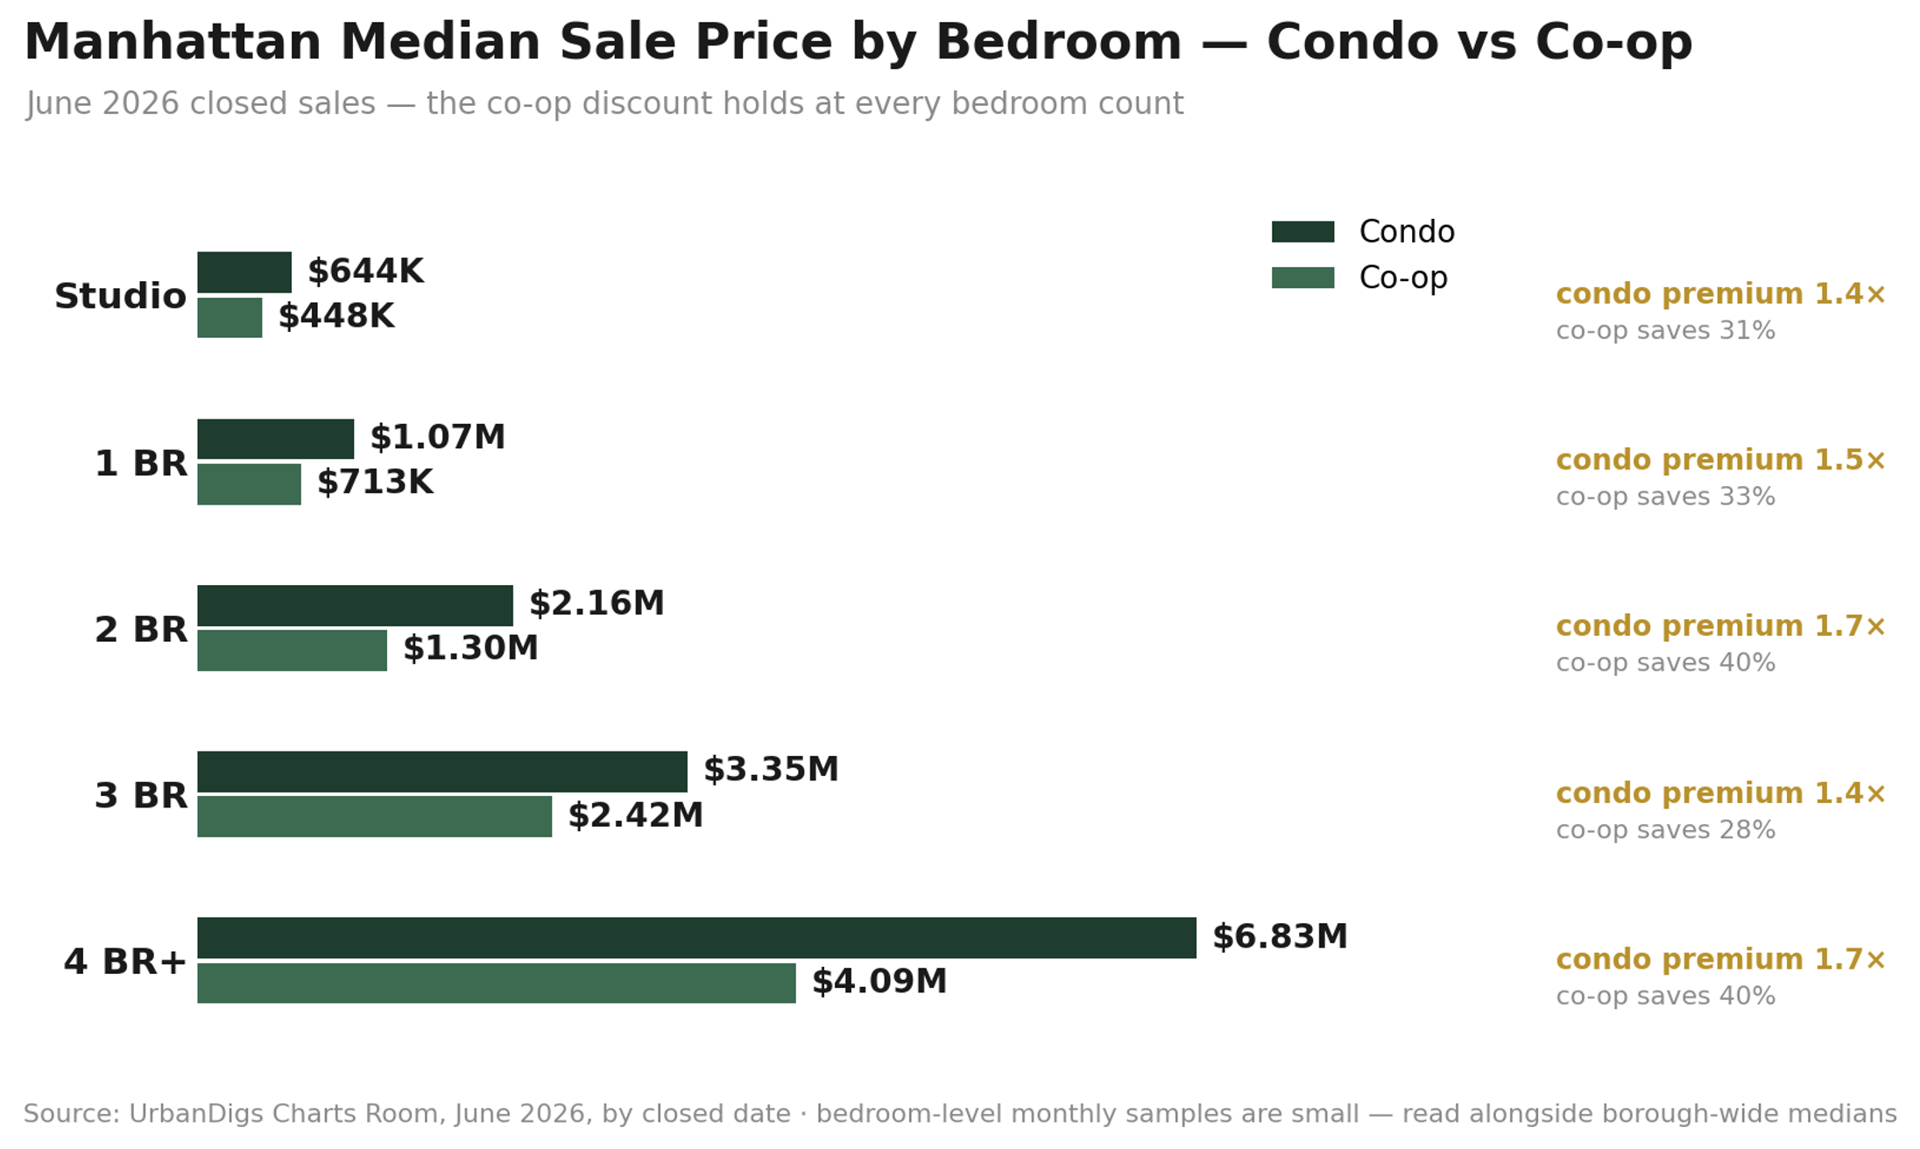
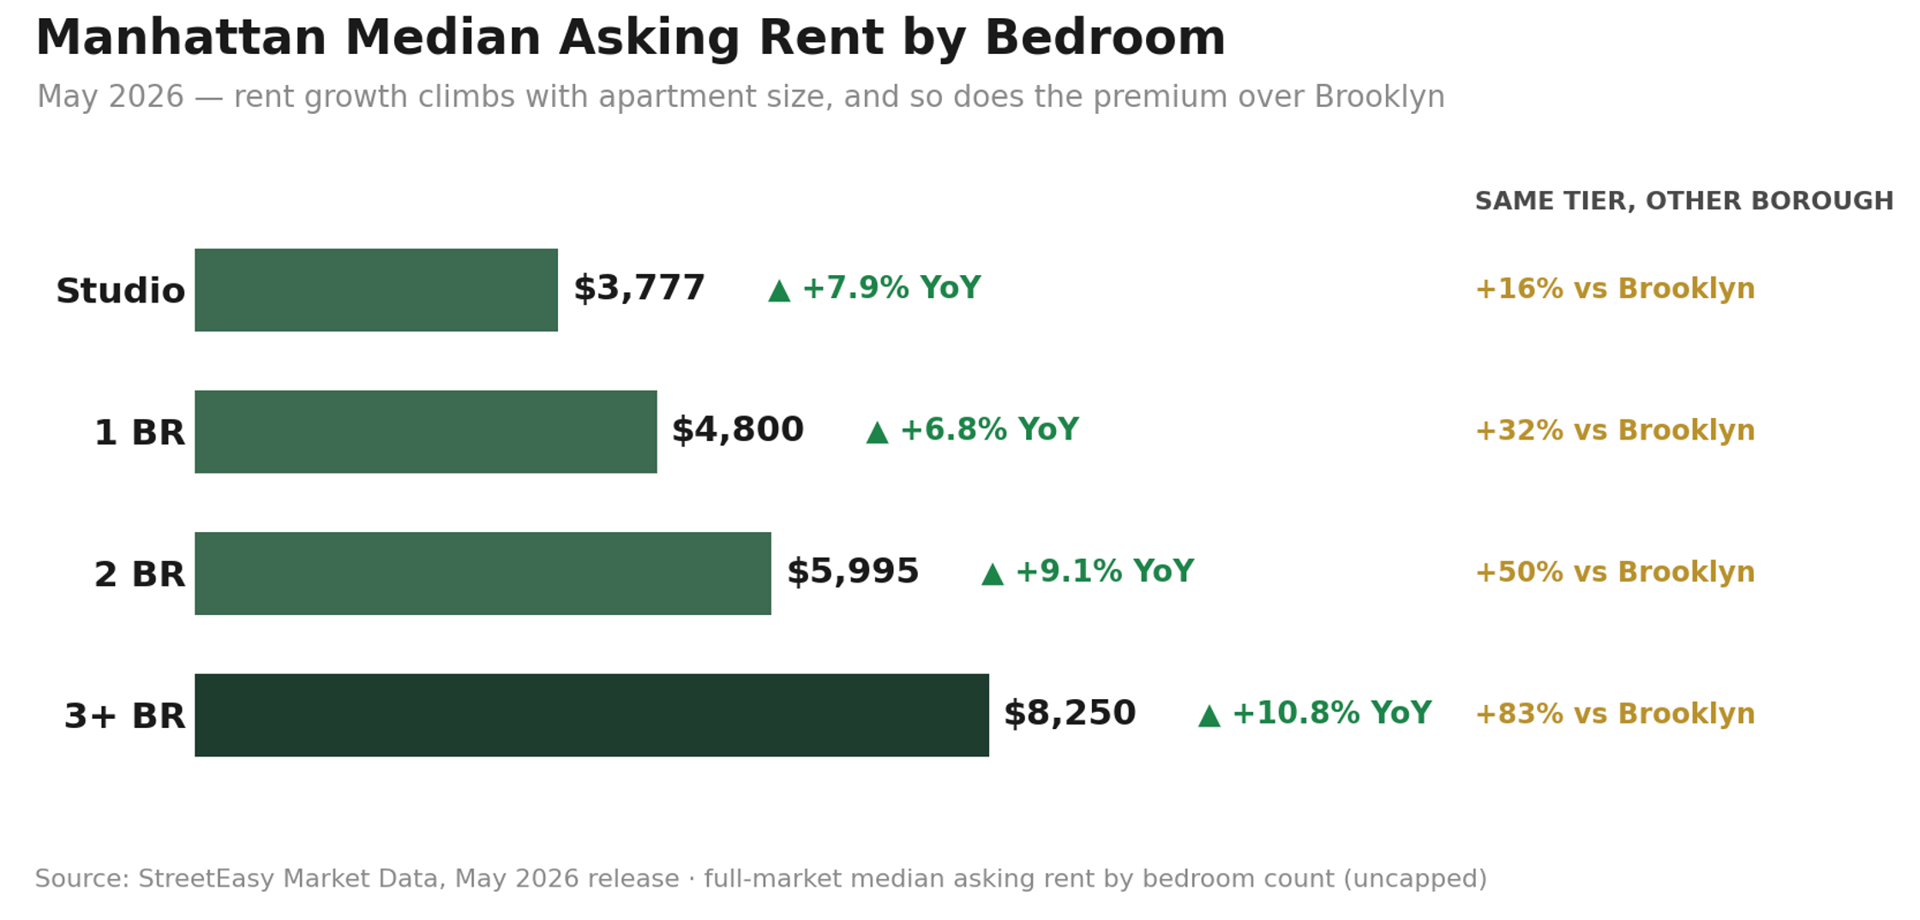
- PPSF was the one soft print: $1,426, roughly flat on both MoM (–0.6%) and YoY (–0.7%) — likely transaction mix rather than a change in pricing power, especially set against bedroom-level data showing 2BR condos up 8.7% YoY.
- Bedroom-level data shows a flight to core product: co-op studios and 1BRs and condo 2BRs are appreciating; larger 3BR/4BR+ units softened both YoY and from May.
- A data caveat worth flagging: recorded closed-sale counts (706, –31.7% MoM) look dramatic but reflect public-record recording lag on the most recent month, not a genuine drop in activity. Contracts signed is the cleaner real-time demand read, and it moved the opposite direction.
- Days on market fell 10.5% from May to 68, even as it sits 6.2% above June 2025 — a market still absorbing listings quickly by historical standards.
Outlook
Manhattan heads into the back half of summer with every structural signal pointing the same direction: demand building, supply contracting, and negotiating room shrinking. Absent a rate shock or a broader macro disruption, this combination typically sustains firm pricing through Q3. The metric most worth tracking into July is whether PPSF’s flat print was a one-month mix effect or the start of a genuine pause — the bedroom-level data this month favors the mix-effect explanation.
■ For Sellers: Conditions remain about as favorable as this market gets: demand is accelerating, inventory is contracting, and discounts are compressing. Well-prepared, accurately priced listings are converting quickly and often at or above ask.
■ For Buyers: Moving with conviction matters more each month this holds true. Waiting for a materially better entry point means competing against a market that is tightening, not loosening — 8.4% less inventory than a year ago, with less room to negotiate than in May.
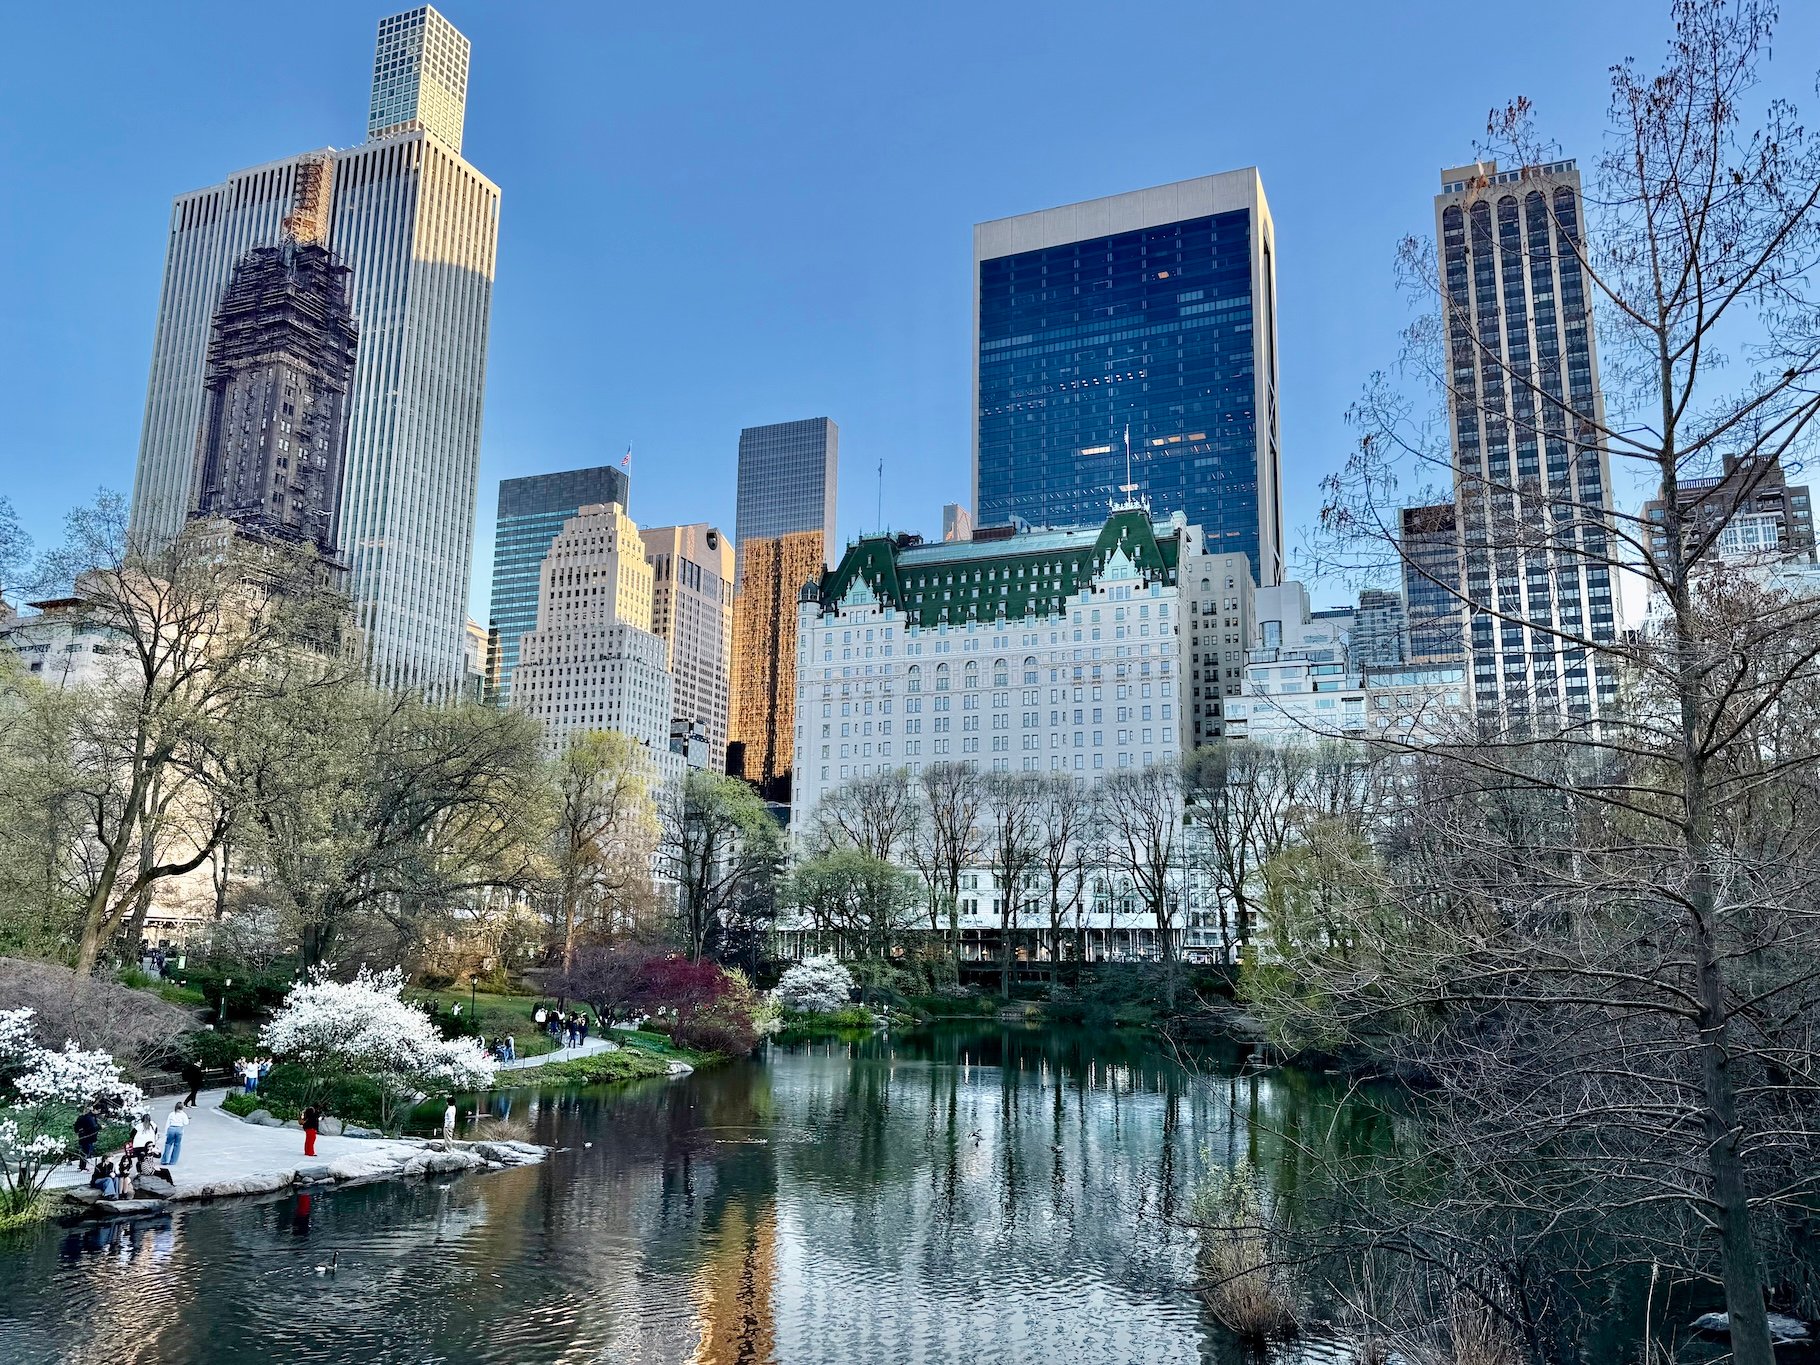
Photo by Rihards Gederts | Howard Hanna NYC
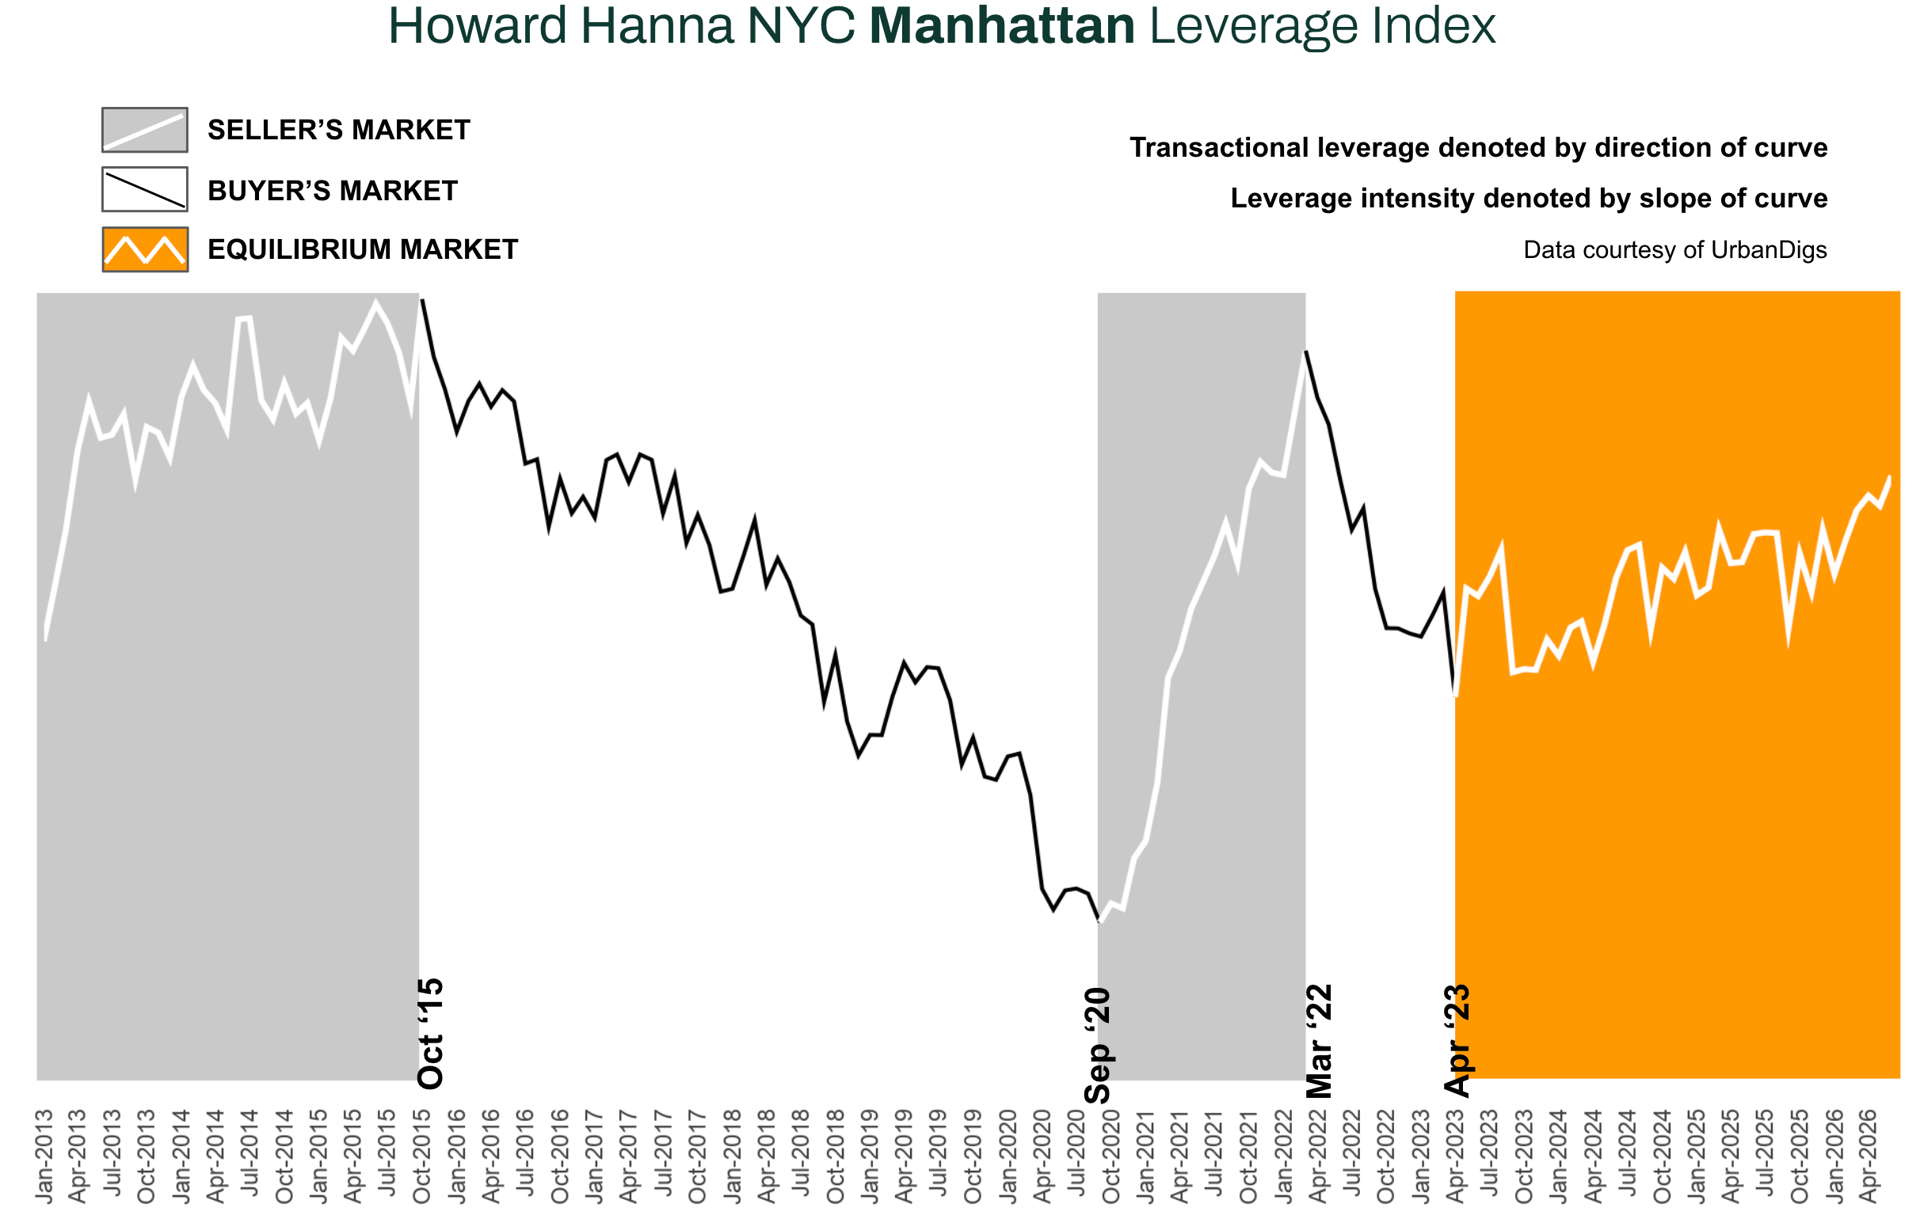
Howard Hanna NYC Manhattan Leverage Index
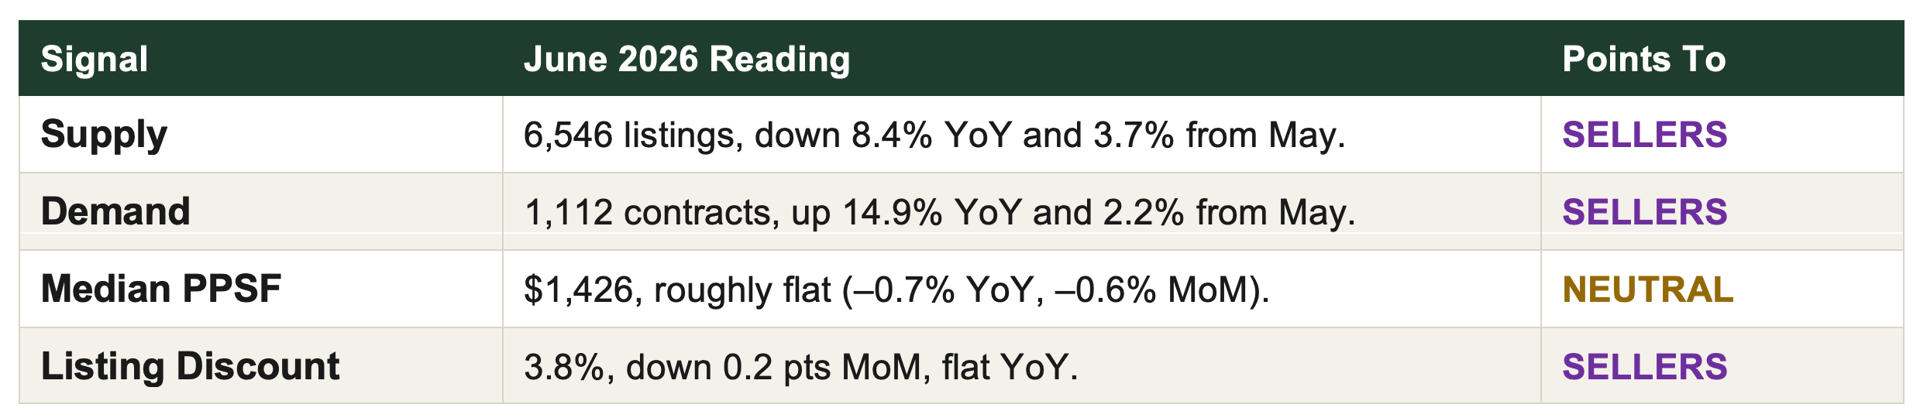
The Howard Hanna NYC Manhattan Leverage Index tracks four market signals — supply, demand, median PPSF, and median listing discount — to gauge the balance of power between buyers and sellers. Tightening supply, accelerating demand, firming PPSF, and compressing discounts all point toward sellers; the reverse combination points toward buyers.
Three of the four core inputs point firmly seller-leaning this month, and the fourth — PPSF — reads as a pause rather than a reversal. Net, Manhattan remains a seller’s market entering the second half of summer, and if anything, the margin has widened since May.
Manhattan Supply
SUPPLY TIGHTENS FURTHER AS THE YOY DEFICIT WIDENS
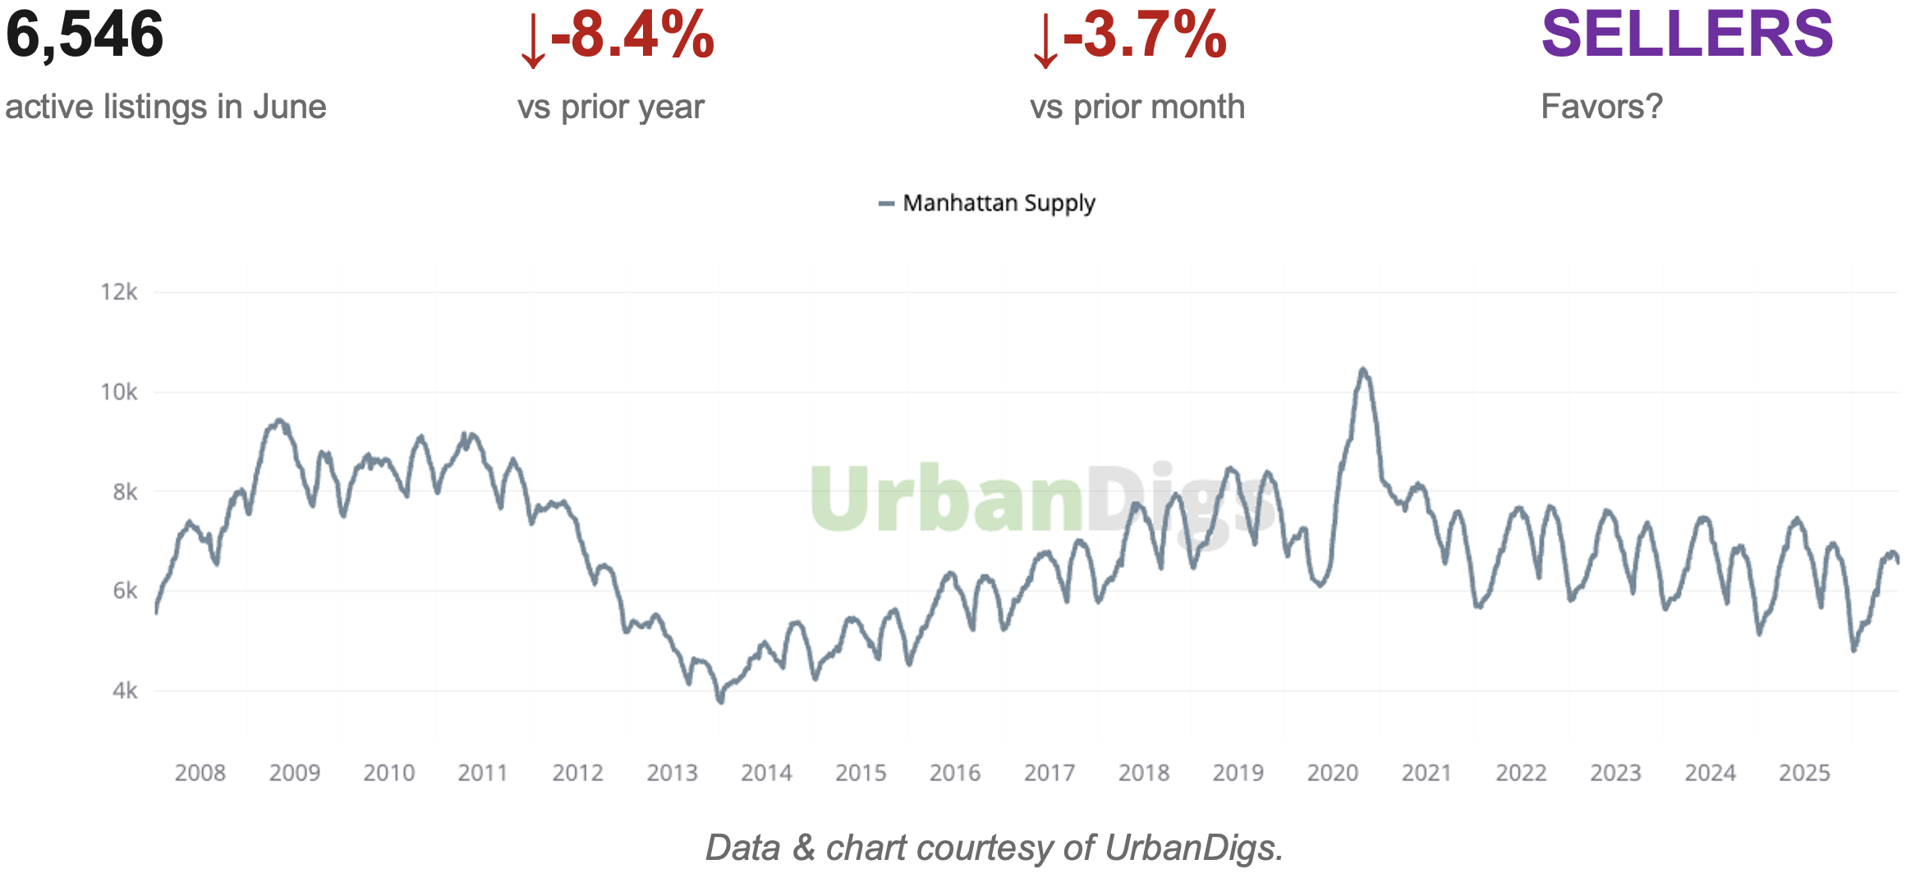
Active Manhattan listings fell to 6,546 in June, down 3.7% from May and now 8.4% below June 2025. As the chart shows, current inventory remains well under the 8,000–9,000 range that was typical before 2020, and June’s pullback moved against the usual seasonal pattern, when listings typically build through early summer.
■ Buyers: The choice set keeps shrinking, not growing. With 8.4% less inventory than a year ago, well-priced listings in your target neighborhood and budget will draw competition — be ready to move when the right unit appears.
■ Sellers: The supply backdrop remains structurally in your favor. Fewer competing listings means less pressure to discount to stand out.
Outlook: Absent a meaningful wave of new listings, the supply deficit should persist through Q3. Watch for the typical late-summer listing push in August/September to test whether this year’s deficit narrows or holds.
Manhattan Demand
DEMAND ACCELERATES — CONTRACTS UP NEARLY 15% YEAR-OVER-YEAR
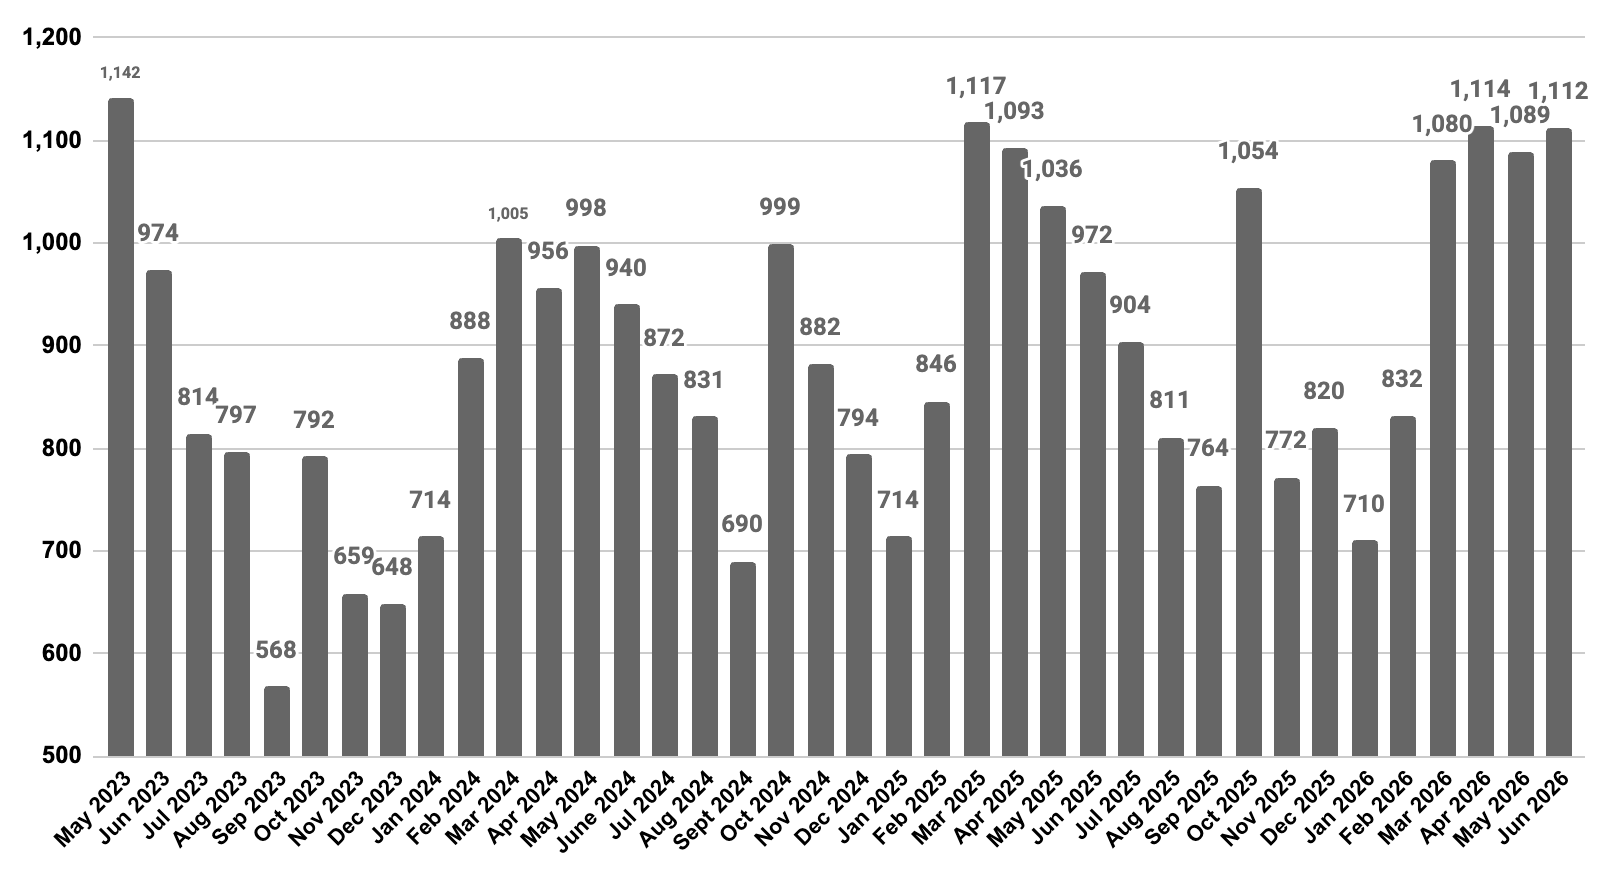
June brought 1,112 signed contracts, up 2.2% from May and 14.9% above June 2025 — the strongest year-over-year demand reading in this report series. Pending sales climbed even further, up 17.0% from May and 26.3% year-over-year to 4,215, pointing to a healthy forward pipeline into July.
■ Buyers: Competition for well-priced listings is real and building. The spring rebound did not fade into summer — it accelerated.
■ Sellers: Demand is confirmed on both a monthly and annual basis. This is as clean a seller signal as this report tracks.
Outlook: With pending sales up sharply and inventory still contracting, contract activity should hold near current levels into July before the typical late-summer seasonal cooling begins.
Manhattan Median PPSF
PER-SQUARE-FOOT PRICING PAUSES — MIX, NOT WEAKNESS
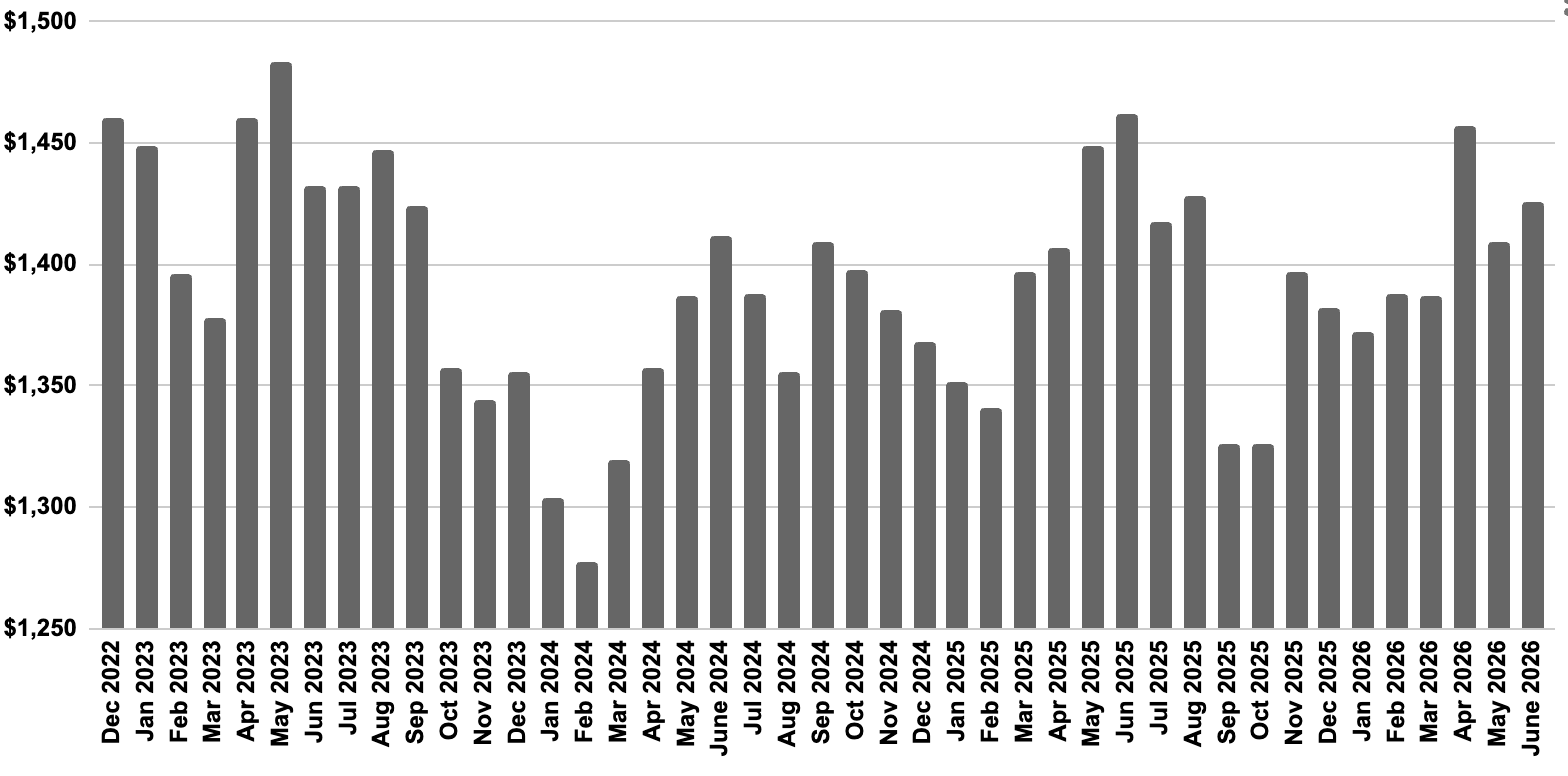
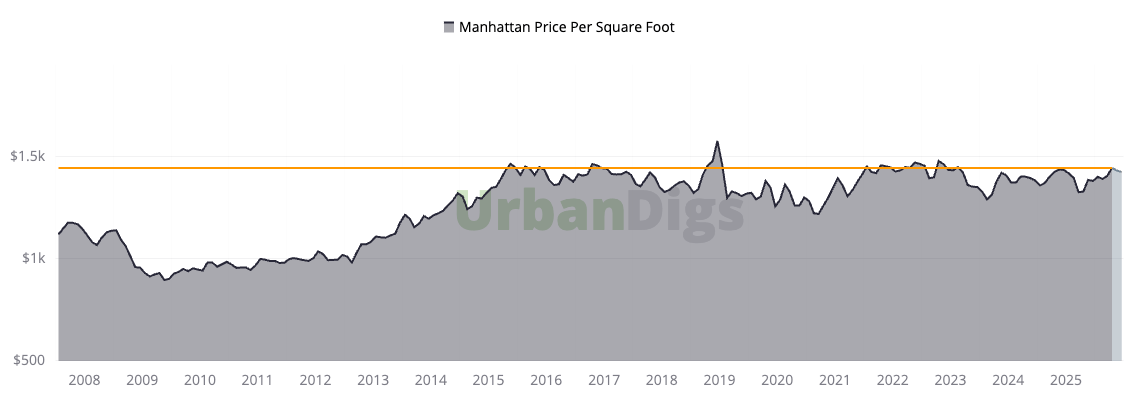
Median PPSF came in at $1,426 in June, down slightly both from May (–0.6%) and June 2025 (–0.7%). Taken alone, this would read as a soft print. Set against the bedroom-level data above, it looks like a transaction-mix effect: 2BR condos gained 8.7% year-over-year even as 3BR and 4BR+ units — which carry outsized weight in a median PPSF calculation — pulled back sharply both YoY and from May. Manhattan PPSF has held in a tight, well-established band for over a decade; June’s reading sits within that range, not below it.
■ Buyers: Value is asset-specific this month. Larger units saw real price relief; core one- and two-bedroom product did not.
■ Sellers: The pricing floor is intact. A flat monthly PPSF print alongside accelerating demand and shrinking discounts is not a softening market — it is a market absorbing a different mix of product.
Outlook: Expect PPSF to firm back toward the $1,440–$1,460 range if June’s mix shift toward smaller units reverses even partially in July, consistent with typically active summer contract volume.
Manhattan Median Listing Discount
NEGOTIATING ROOM STAYS NEAR MULTI-YEAR LOWS
The median listing discount held at 3.8% in June, down 0.2 points from May and essentially unchanged from June 2025. In dollar terms, a buyer purchasing a $1.5M listing is negotiating roughly $57,000 off the final asking price — modest by historical standards, and consistent with 13.5% of April sales closing above ask entirely.
■ Buyers: Come in with a clean, competitive offer. The data does not support anchoring to a deep discount on a well-priced listing.
■ Sellers: Pricing power remains firm. Accurately priced listings are converting near ask, and a meaningful share are exceeding it.
Outlook: With demand accelerating and supply still contracting, the discount is more likely to hold in the high-3% range through the summer than to widen meaningfully.
Rental Remarks
ASKING RENTS FIRM AT $4,927 — UP 7.2% YEAR-OVER-YEAR
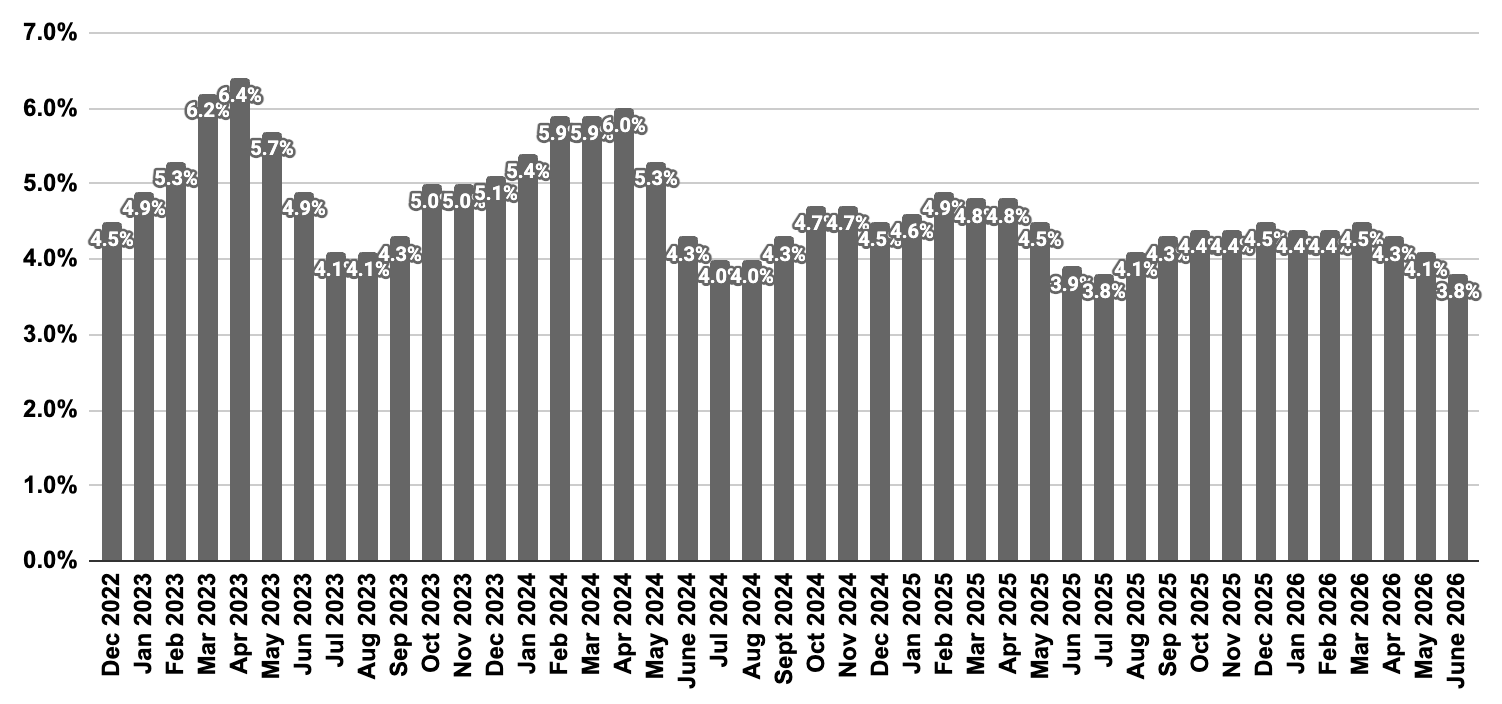
Manhattan’s median asking rent reached $4,927 in May 2026, up 1.1% from April and 7.2% year-over-year. Active rental inventory rose to 15,489 units (+5.1% from April) but remains 13.0% below May 2025 — the structural deficit that has defined this market since 2023 is still firmly in force. The share of listings taking a price cut fell to 11.9%, down from 12.8% in April and 13.5% a year ago — among the lowest discount rates of any major rental market, a clear signal of firm landlord pricing power.
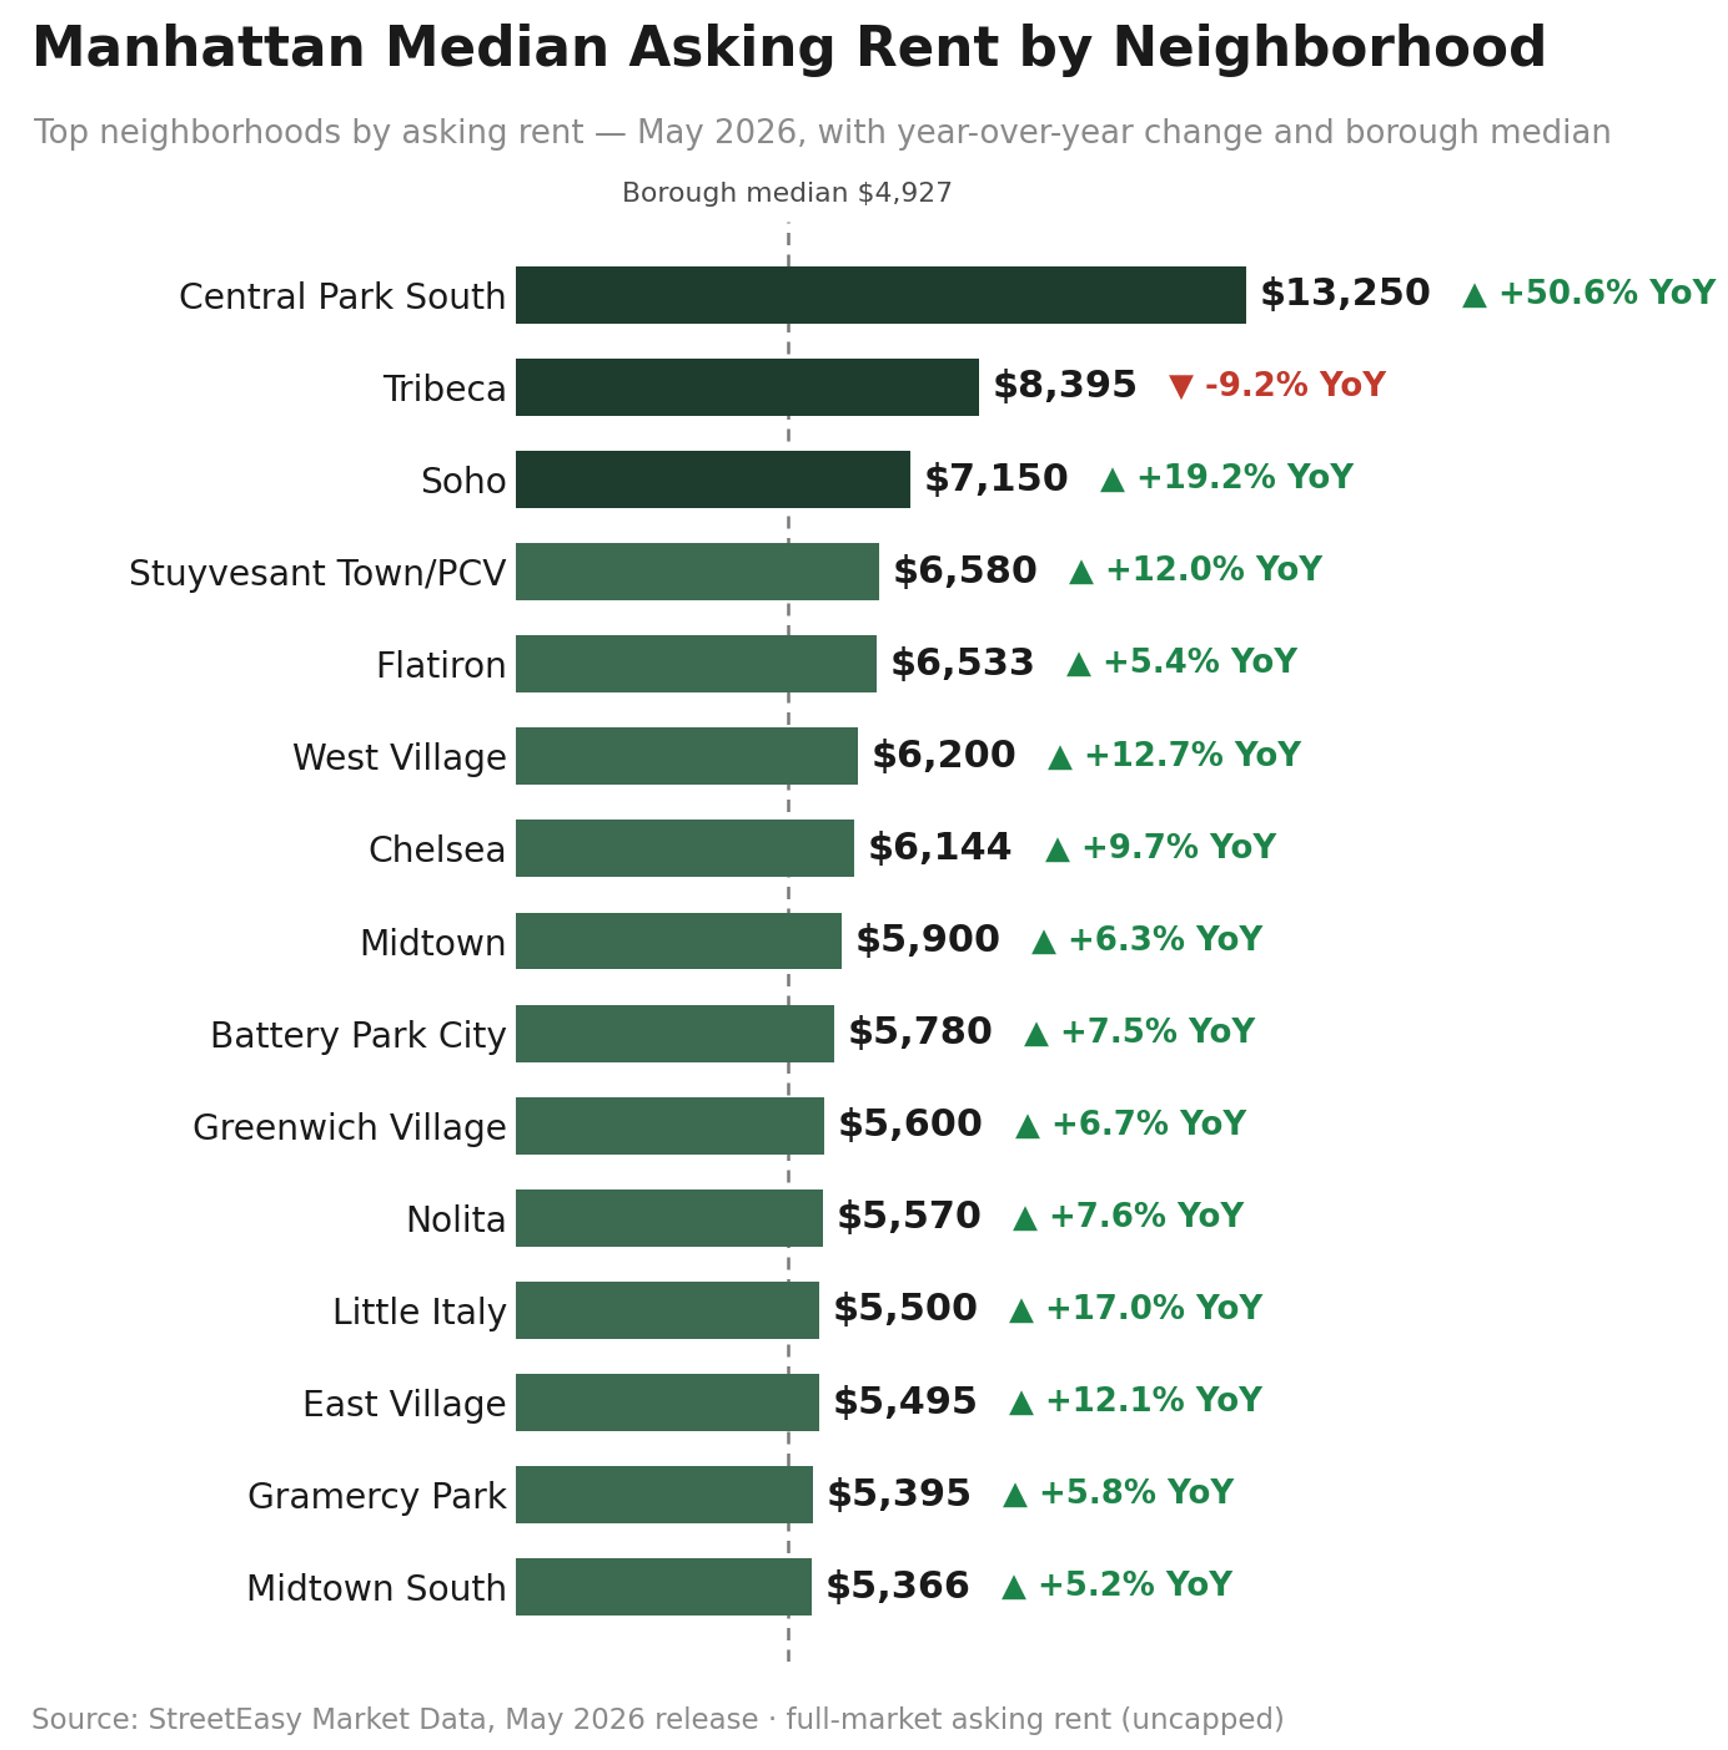
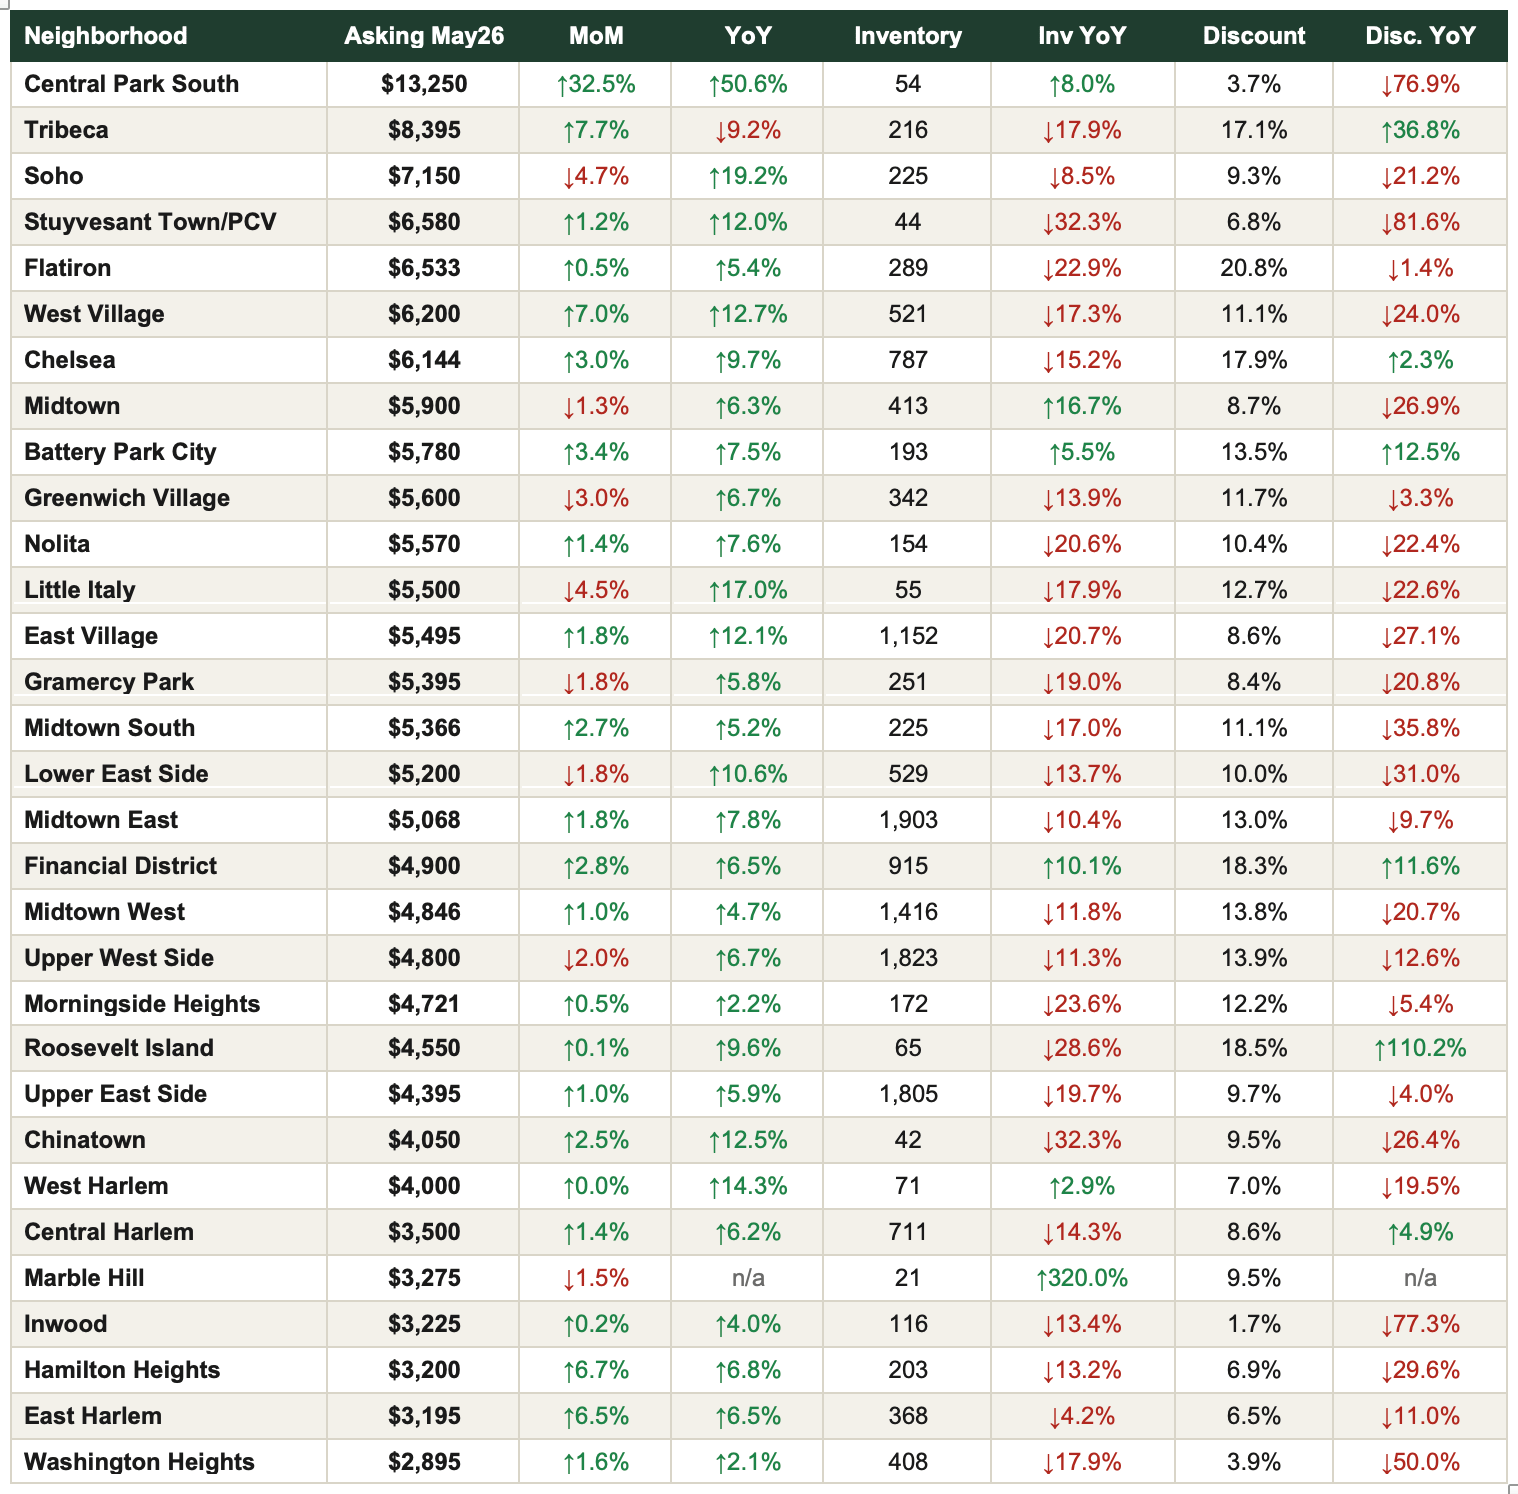
Central Park South continues to lead on price at $13,250 — up a striking 50.6% year-over-year, though this ultra-luxury micro-market (54 active listings) is prone to large swings from a handful of trophy leases. Among liquid, high-volume neighborhoods, Tribeca ($8,395), Soho ($7,150), and West Village ($6,200) anchor the top of the market.
On the accessible end, Washington Heights ($2,895), East Harlem ($3,195), and Hamilton Heights ($3,200) remain Manhattan’s most attainable submarkets, each still posting solid annual gains. Midtown East is Manhattan’s single deepest rental pool at 1,903 active listings, followed by Upper West Side (1,823) and Upper East Side (1,805).
■ For Renters: Inventory is thin and getting thinner in the neighborhoods you’d most want — 13.0% fewer listings than a year ago citywide, and discount share near record lows. Move decisively on a well-priced unit; there is little evidence landlords need to negotiate.
■ For Landlords: Fundamentals remain about as favorable as this market gets: rents up 7.2% YoY, inventory down 13.0% YoY, and fewer than 12% of listings cutting price. This is a hold-and-renew environment.
Outlook: With inventory still double-digit percent below last year and discount share near cycle lows, expect asking rents to continue firming through peak leasing season (July–September). The main risk to this trajectory is a meaningful mortgage-rate decline that pulls marginal renters toward buying — not evident in current rate data (see Mortgage Remarks below).
Source: StreetEasy Market Data, May 2026 release · median asking rent, active rental inventory, discount share · full market, uncapped · 31 Manhattan submarkets shown.
Mortgage Remarks
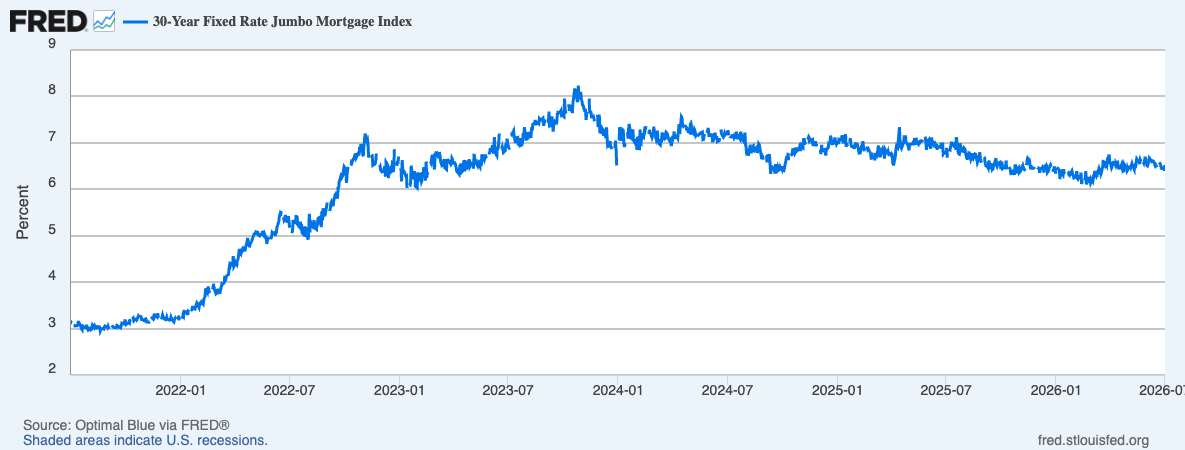
Courtesy of the Federal Reserve Bank of St. Louis (FRED) and Bank of America, Chase, and Wells Fargo.
RATES DRIFT HIGHER AS THE FED TURNS MORE HAWKISH
Average 30-year jumbo mortgage rates were running in the 6.5%–6.7% range as of late June 2026, up modestly from the roughly 6.1% low seen earlier this year. The move follows the Federal Reserve’s June 17 decision to hold its benchmark rate at 3.50%–3.75% for a fourth consecutive meeting under new Chair Kevin Warsh — a hold that came with a meaningfully more hawkish tone. The Fed’s updated projections now show more officials expecting rates to end 2026 higher rather than lower, with inflation expectations revised up (PCE now projected near 3.6%, versus 2.7% previously), driven partly by energy-price pressure. Markets are currently pricing roughly a 25-basis-point hike by October.
■ Buyers: Financing costs are a real and rising factor, not a fading one. Rate-sensitive buyers should have financing pre-arranged and plan around a 6.5%+ environment rather than banking on relief.
■ Sellers: Manhattan’s buyer pool is more equity-heavy and rate-insulated than the typical U.S. market, which helps explain why demand accelerated even as rates firmed. That insulation is a genuine structural advantage this cycle.
Outlook: With the Fed’s own dot plot now tilted toward a possible hike rather than a cut, the base case is that jumbo rates hold in the mid-6% range or drift modestly higher through Q3, barring a clear downside inflation surprise.
Investor Insights
Currency and International Demand — A Trend Reversal Worth Flagging
This is a meaningful change from recent months: the U.S. dollar has strengthened, not weakened, through June 2026. The dollar index broke above the 100 level in June — its highest level since May 2025 — after the European Central Bank’s June 11 rate hike to 2.25% was outweighed by a more hawkish Federal Reserve. EUR/USD has eased to roughly 1.14–1.15, and GBP/USD sits near 1.34. For European and UK buyers, this reverses the FX tailwind that supported international demand earlier in the cycle — New York property is no longer getting cheaper in euro or sterling terms from currency movement alone, and on the margin is now modestly more expensive than a few months ago.
This does not offset Manhattan’s underlying fundamentals, but it is a genuine change in the calculus for currency-sensitive buyers, and worth raising proactively with international clients rather than defaulting to the weaker-dollar talking point used earlier this year.
Domestic Investors and Yield
The rent-versus-buy math continues to tighten. At a $4,927 median Manhattan asking rent (+7.2% YoY) against a $1.29M median sale price, the carrying cost of ownership on a well-priced, well-financed co-op is increasingly competitive with renting for buyers who have the capital and qualify at current rates. That said, June’s firmer mortgage-rate backdrop is a real offset to this calculus relative to earlier in the year — the rent-vs-buy conversation is worth having, but it is a closer call today than when rates sat near 6.1%.
New This Month: The Investor Yield Map
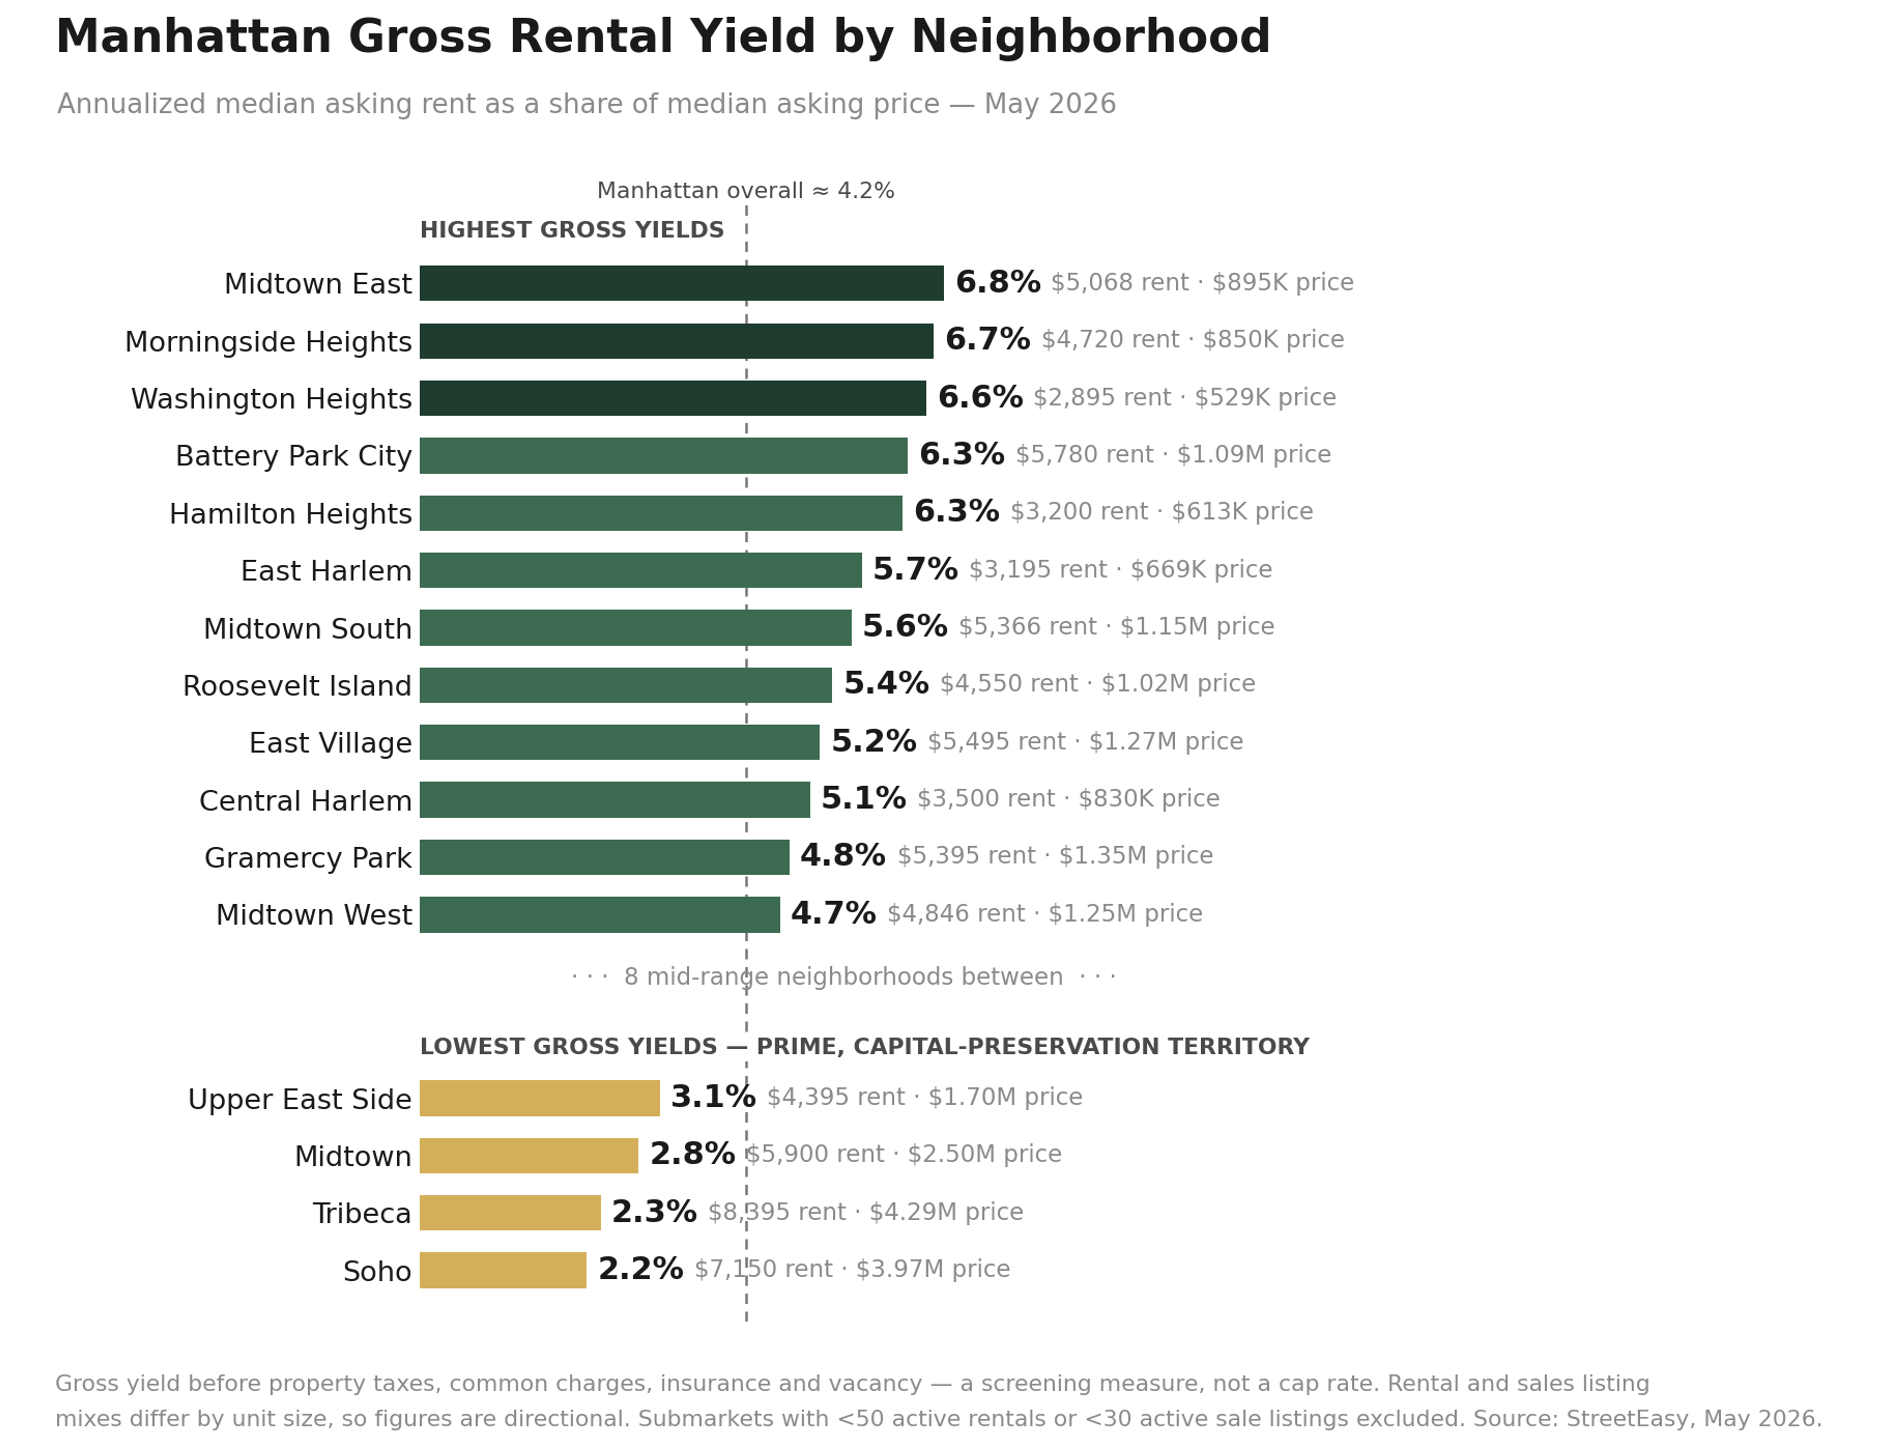
For the first time in this report, we have mapped gross rental yield — annualized median asking rent as a share of median asking price — across every Manhattan submarket with meaningful listing depth. The spread is wider than most buyers assume: more than three full percentage points separate the top of the map from the bottom. Midtown East leads the borough at 6.8% gross ($5,068 median rent against an $895K median ask) — and unlike most high-yield readings, it comes with real depth behind it: roughly 1,900 active rentals and 1,300 active sale listings.
The co-op-heavy corridor’s low entry prices set against midtown rents make it the clearest income play on the island. Upper Manhattan follows closely — Morningside Heights (6.7%), Washington Heights (6.6%) and Hamilton Heights (6.3%) — alongside Battery Park City (6.3%). At the other end, Soho (2.2%) and Tribeca (2.3%) price like what they are: capital-preservation assets, where the return case rests on appreciation and scarcity rather than cash flow. Borough-wide, Manhattan screens at roughly 4.2% gross.
The Manhattan PPSF Story
Manhattan’s median PPSF has traded in a remarkably narrow band for over a decade — from a post-financial-crisis trough near $950/sf to a sustained plateau above $1,300/sf over the past several years, currently $1,426. This stability, not explosive appreciation, is Manhattan’s defining investment characteristic: a supply-constrained, deeply liquid market that has absorbed multiple macro shocks without a sustained repricing lower. For investors, the case remains capital preservation, currency diversification, and quality of asset — not speculative upside.
References
1. Sales and pricing data — Supply, Demand, PPSF, Listing Discount, Median Sale Price, Days on Market, Leverage Index inputs: UrbanDigs, June 2026 actuals.
2. Bedroom-level median sale price: UrbanDigs Charts Room, 5-year monthly series, by closed date.
3. Rental data (asking rent, bedroom-level asking rent, inventory, discount share, neighborhood table): StreetEasy Market Data, May 2026 release.
4. Sales cross-check by neighborhood: StreetEasy Market Data, May 2026 release.
5. Mortgage rate data: Optimal Blue via Federal Reserve Bank of St. Louis (FRED); Bank of America, Chase, Wells Fargo.
7. Currency data: EUR/USD, GBP/USD, and U.S. Dollar Index market data, as of late June 2026.
8. Gross rental yield: annualized StreetEasy median asking rent ÷ median asking price, by neighborhood, May 2026 release. Screening measure; thin submarkets excluded (see chart footnote).
If you would like to chat about the most recent market activity,
Howard Hanna NYC brings the nation’s largest independent and family-owned brokerage to New York City, uniting the strength of a national network with the insight and sophistication of a local firm. Formed through joining forces with Elegran Real Estate, Howard Hanna NYC delivers a seamless, full-service experience backed by more than 15,000 agents across 500 offices in 14 states. The firm’s forward-thinking, agent-first culture continues to shape the future of real estate across Manhattan and the Tri-State area.Learn more at
www.howardhannanyc.com.