
Weekly Manhattan and Brooklyn Market Update: 9/15
Elegran September 13, 2025
Elegran September 13, 2025
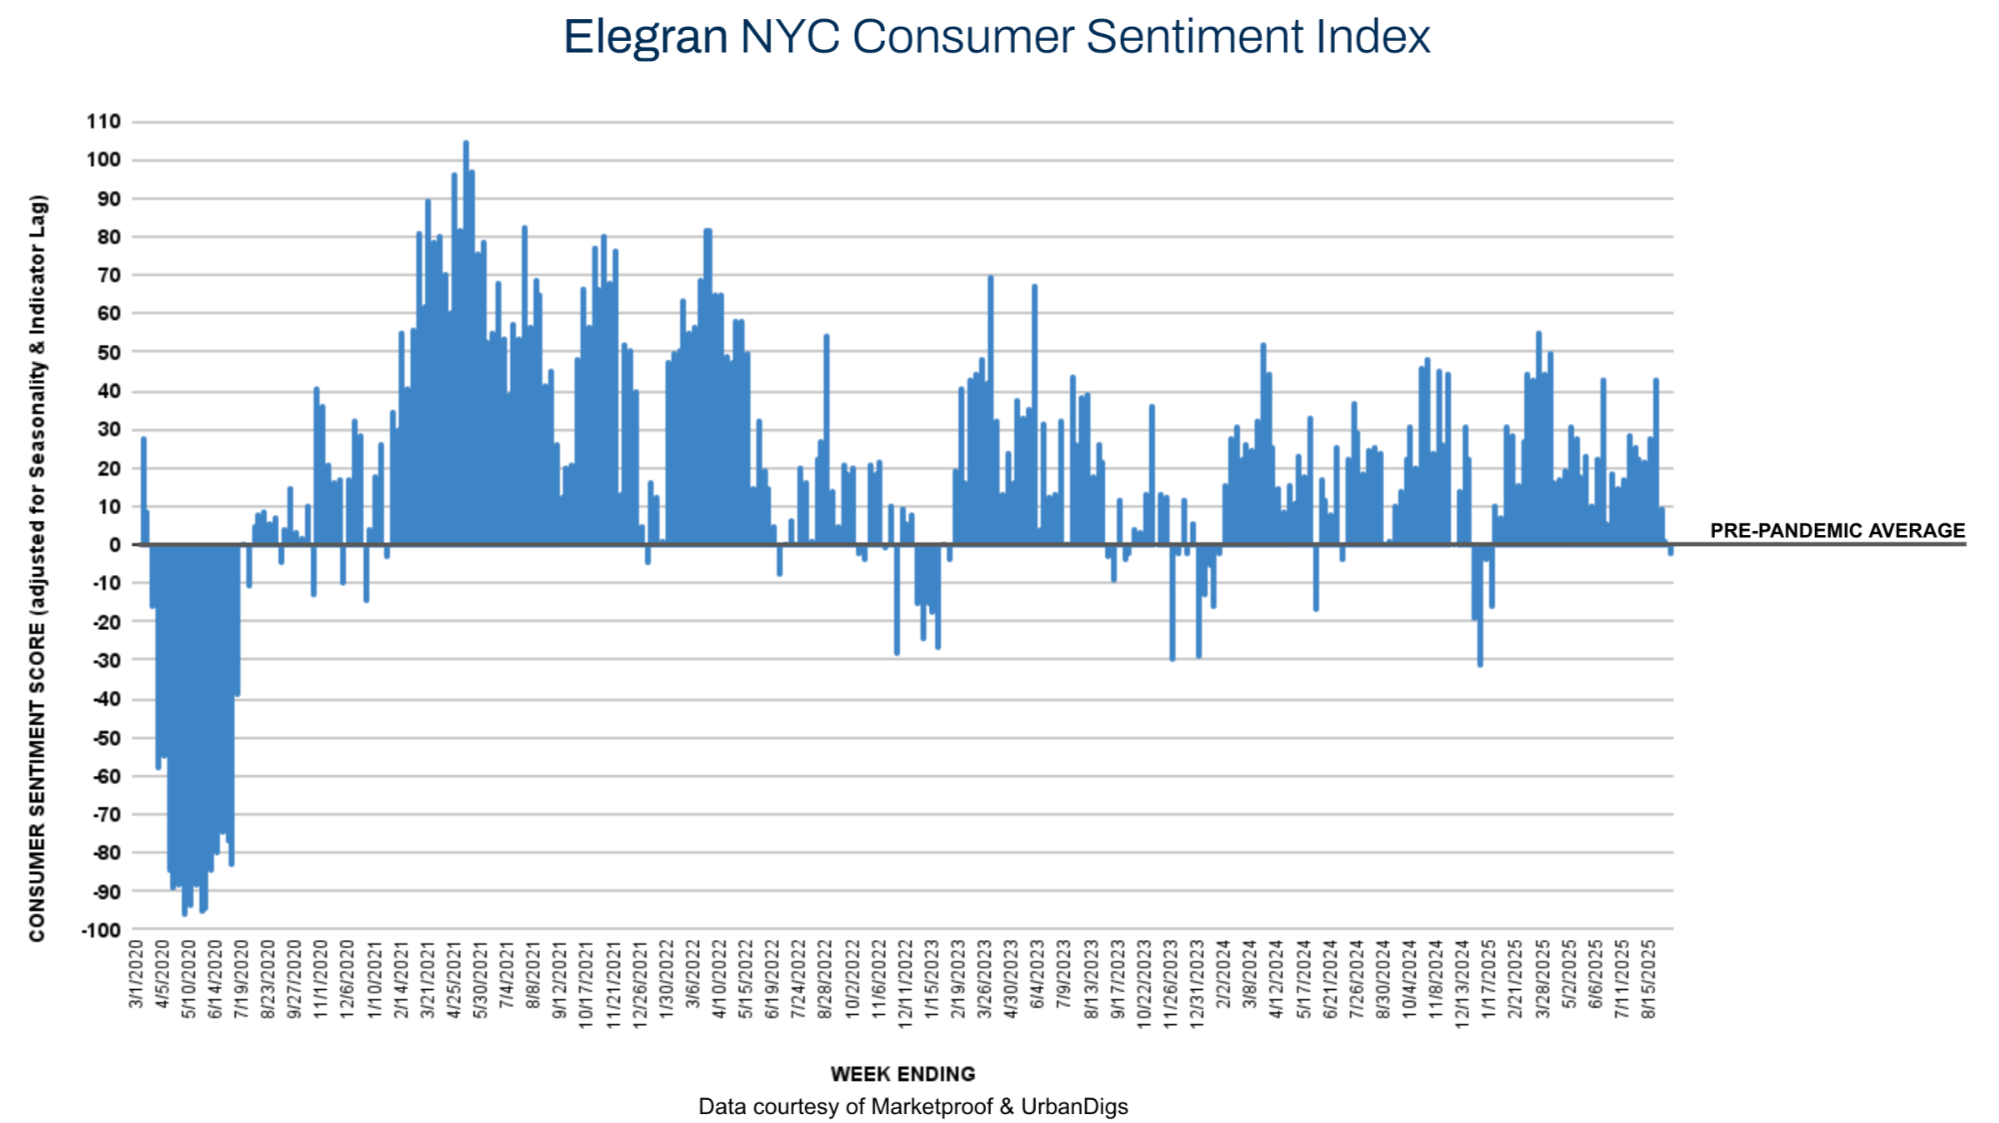
This week’s market highlighted a contrast between the boroughs. Inventory continued to rise across both Manhattan and Brooklyn, giving buyers more choice, but buyer response split: Brooklyn saw a rebound in contracts and stronger sentiment, while Manhattan posted its third consecutive decline. Overall, Elegran’s NYC Consumer Sentiment Index dipped into slightly negative territory at –2%, underscoring a cautious early-September tone even as opportunities expand.
Key Takeaways:
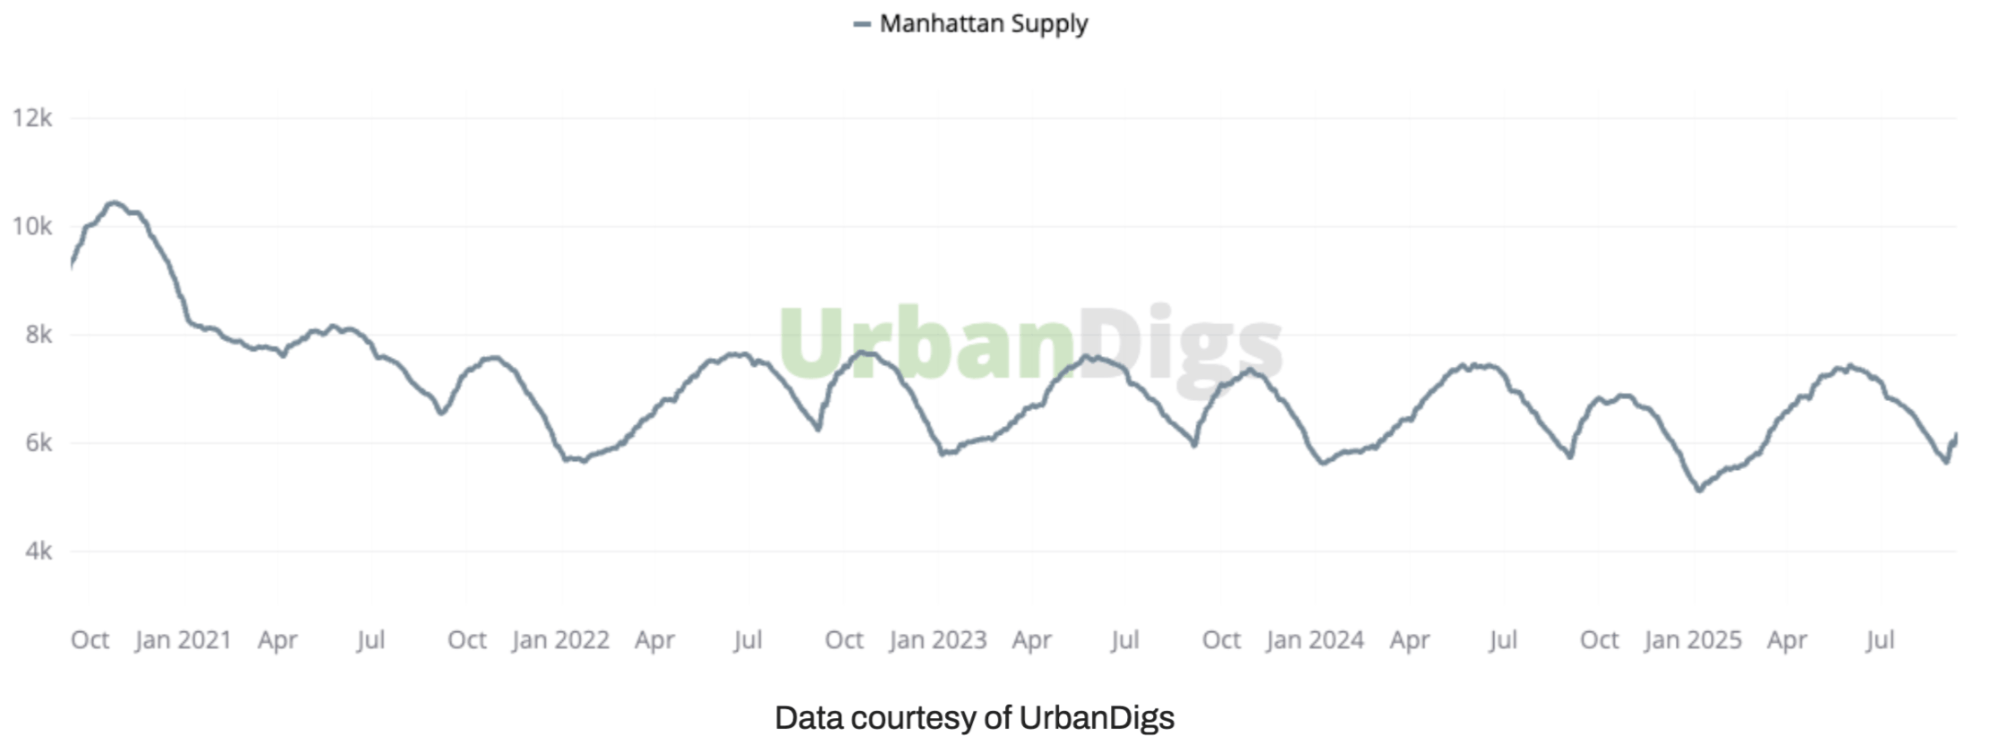
Manhattan’s inventory rose for the second straight week, climbing 5.1% to 6,210 homes. Sellers added 529 new listings, a 3% increase over last week and 9% higher than the same time last year. The seasonal post–Labor Day surge continues to rebuild supply after the summer slowdown.
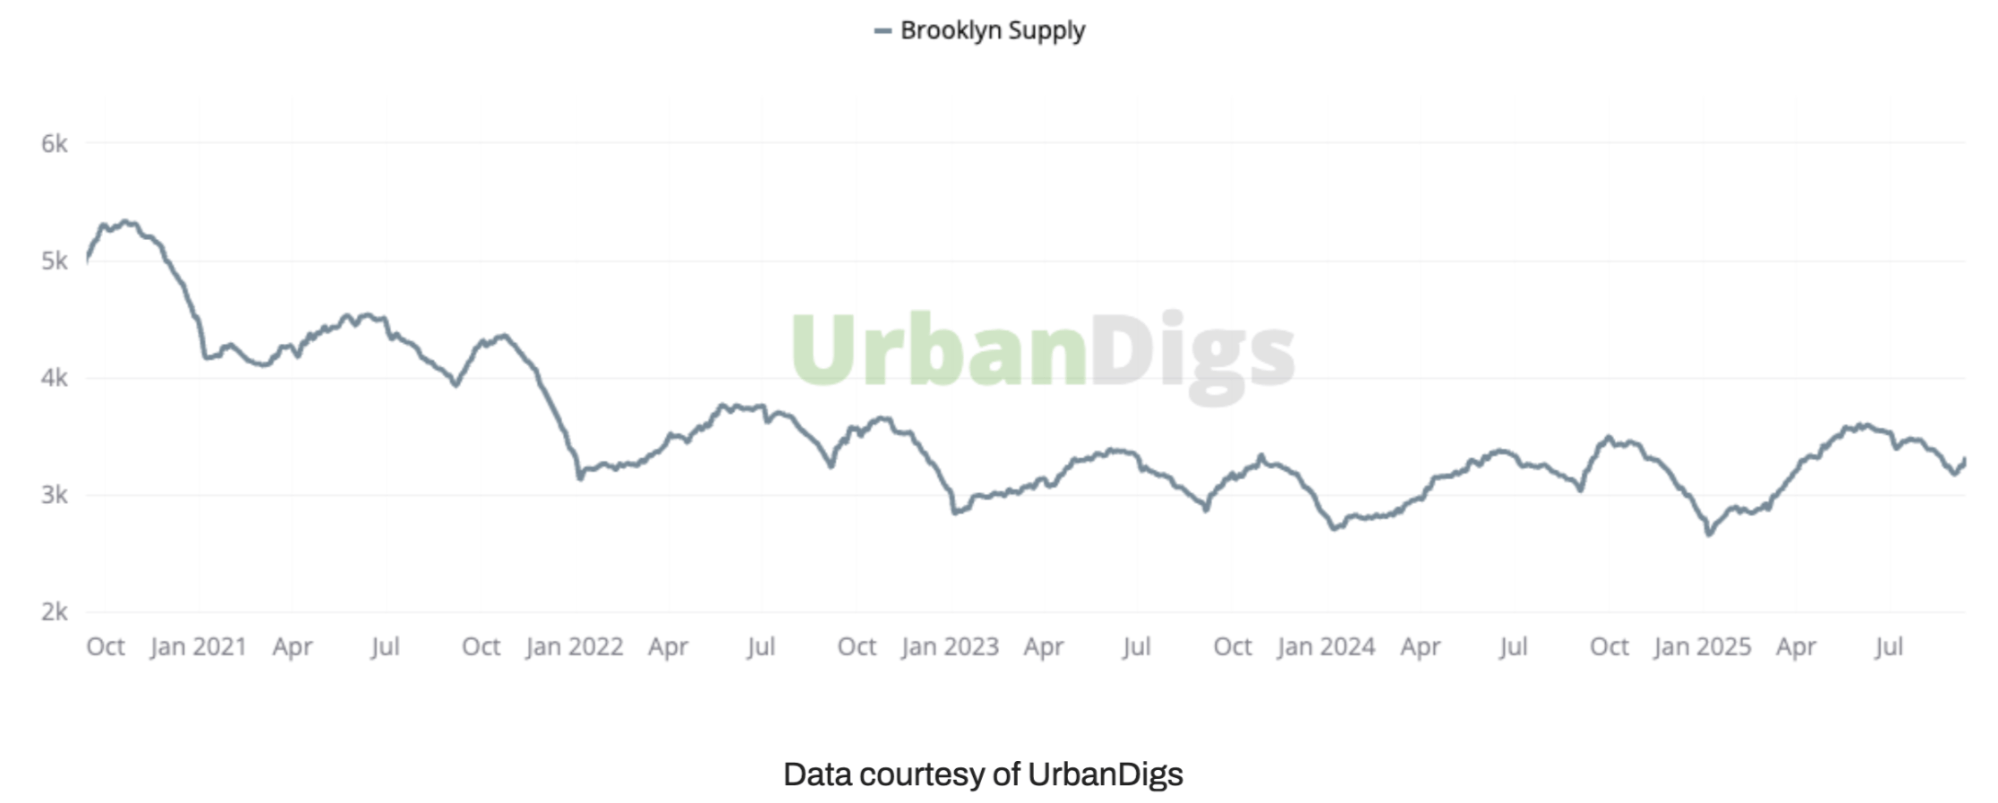
Brooklyn’s supply grew 3.7% to 3,333 homes. New listings totaled 259 units (+8.4% WoW, though ~7% below last year). Overall, supply is now 1.8% above 2024 levels, creating more opportunities for buyers while easing competitive pressure.
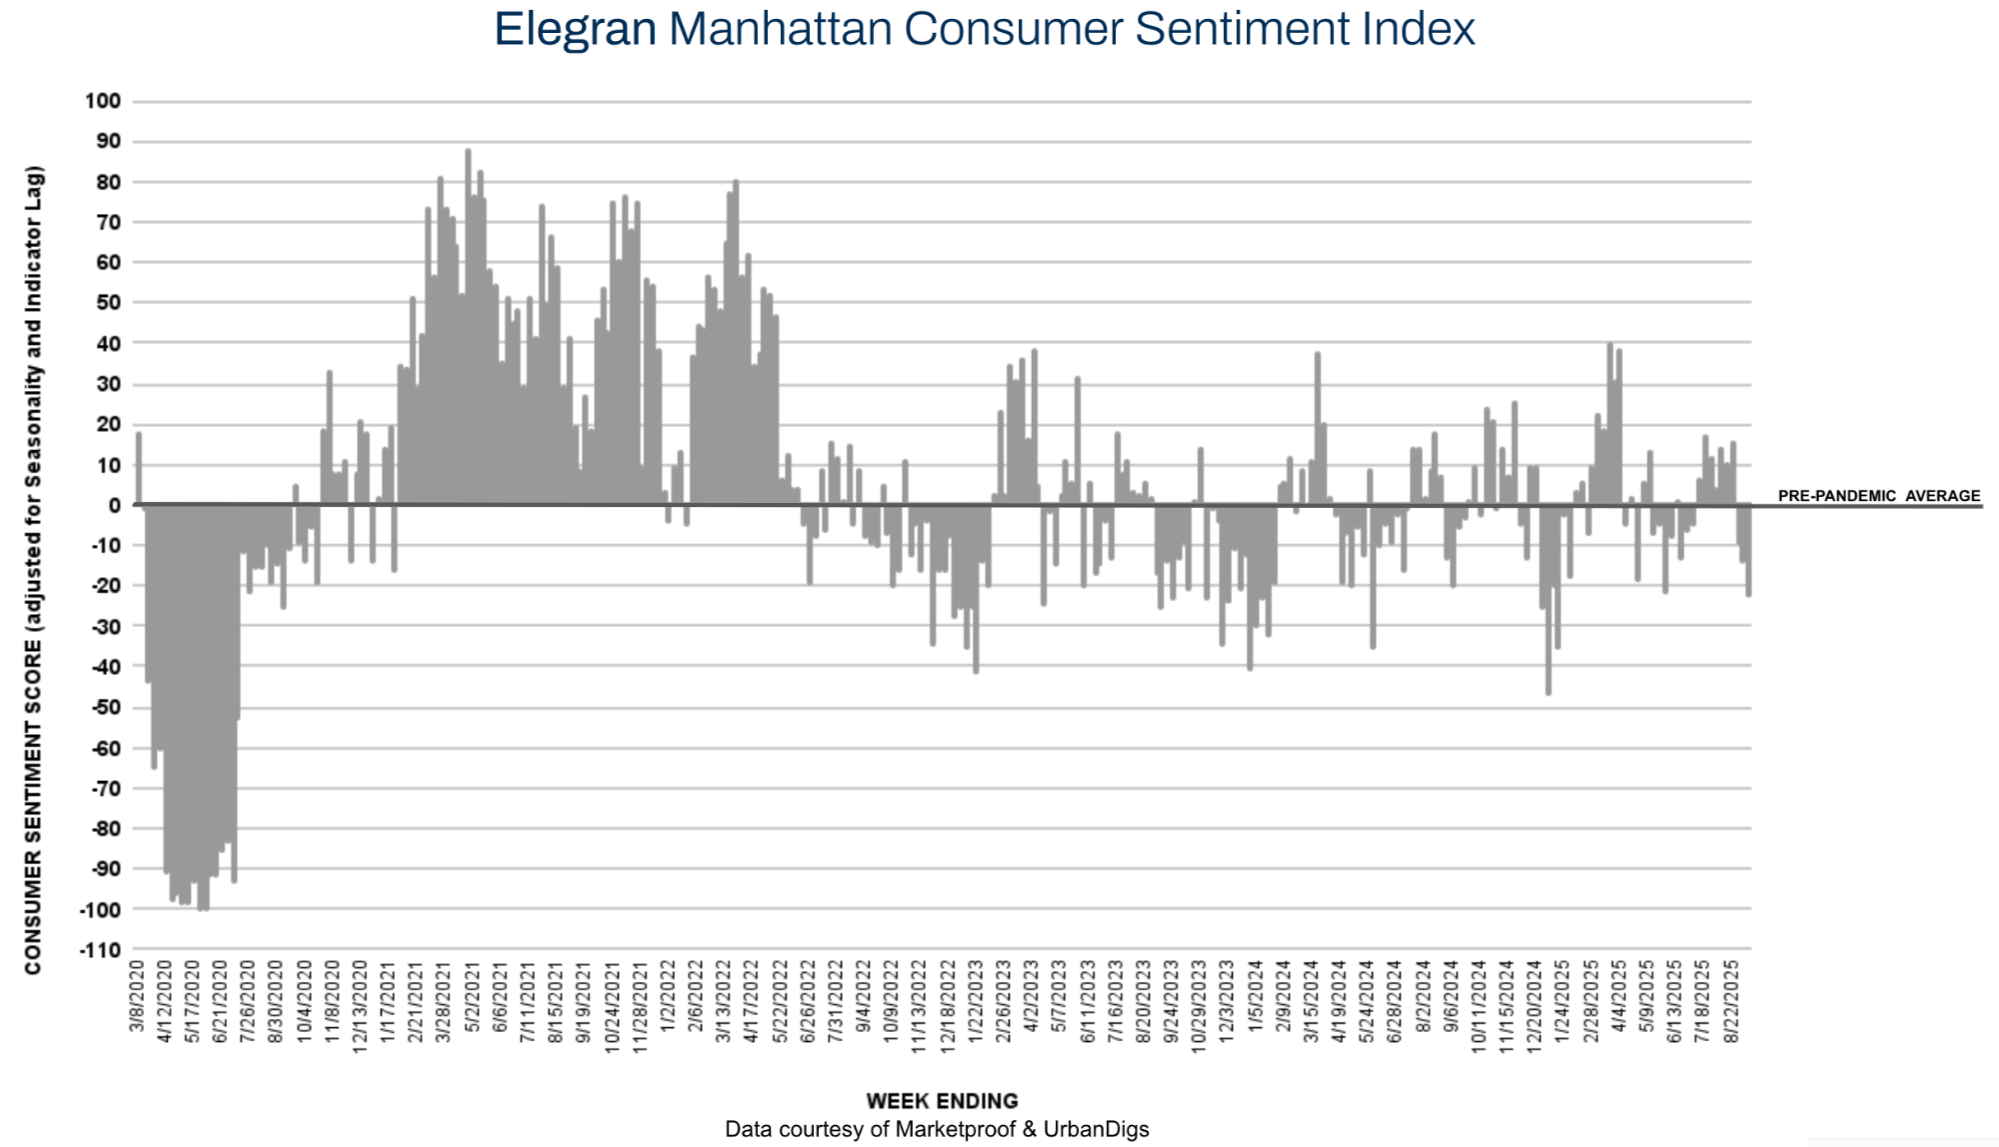
Manhattan contract activity slowed further, with 132 deals signed (–11% WoW, –20% YoY). The Elegran Manhattan Consumer Sentiment Index dropped from –15% to –22%, its third consecutive weekly decline. This dip reflects the usual early-September lull, though sentiment could rebound as buyers engage with fresh listings and potential interest rate adjustments.
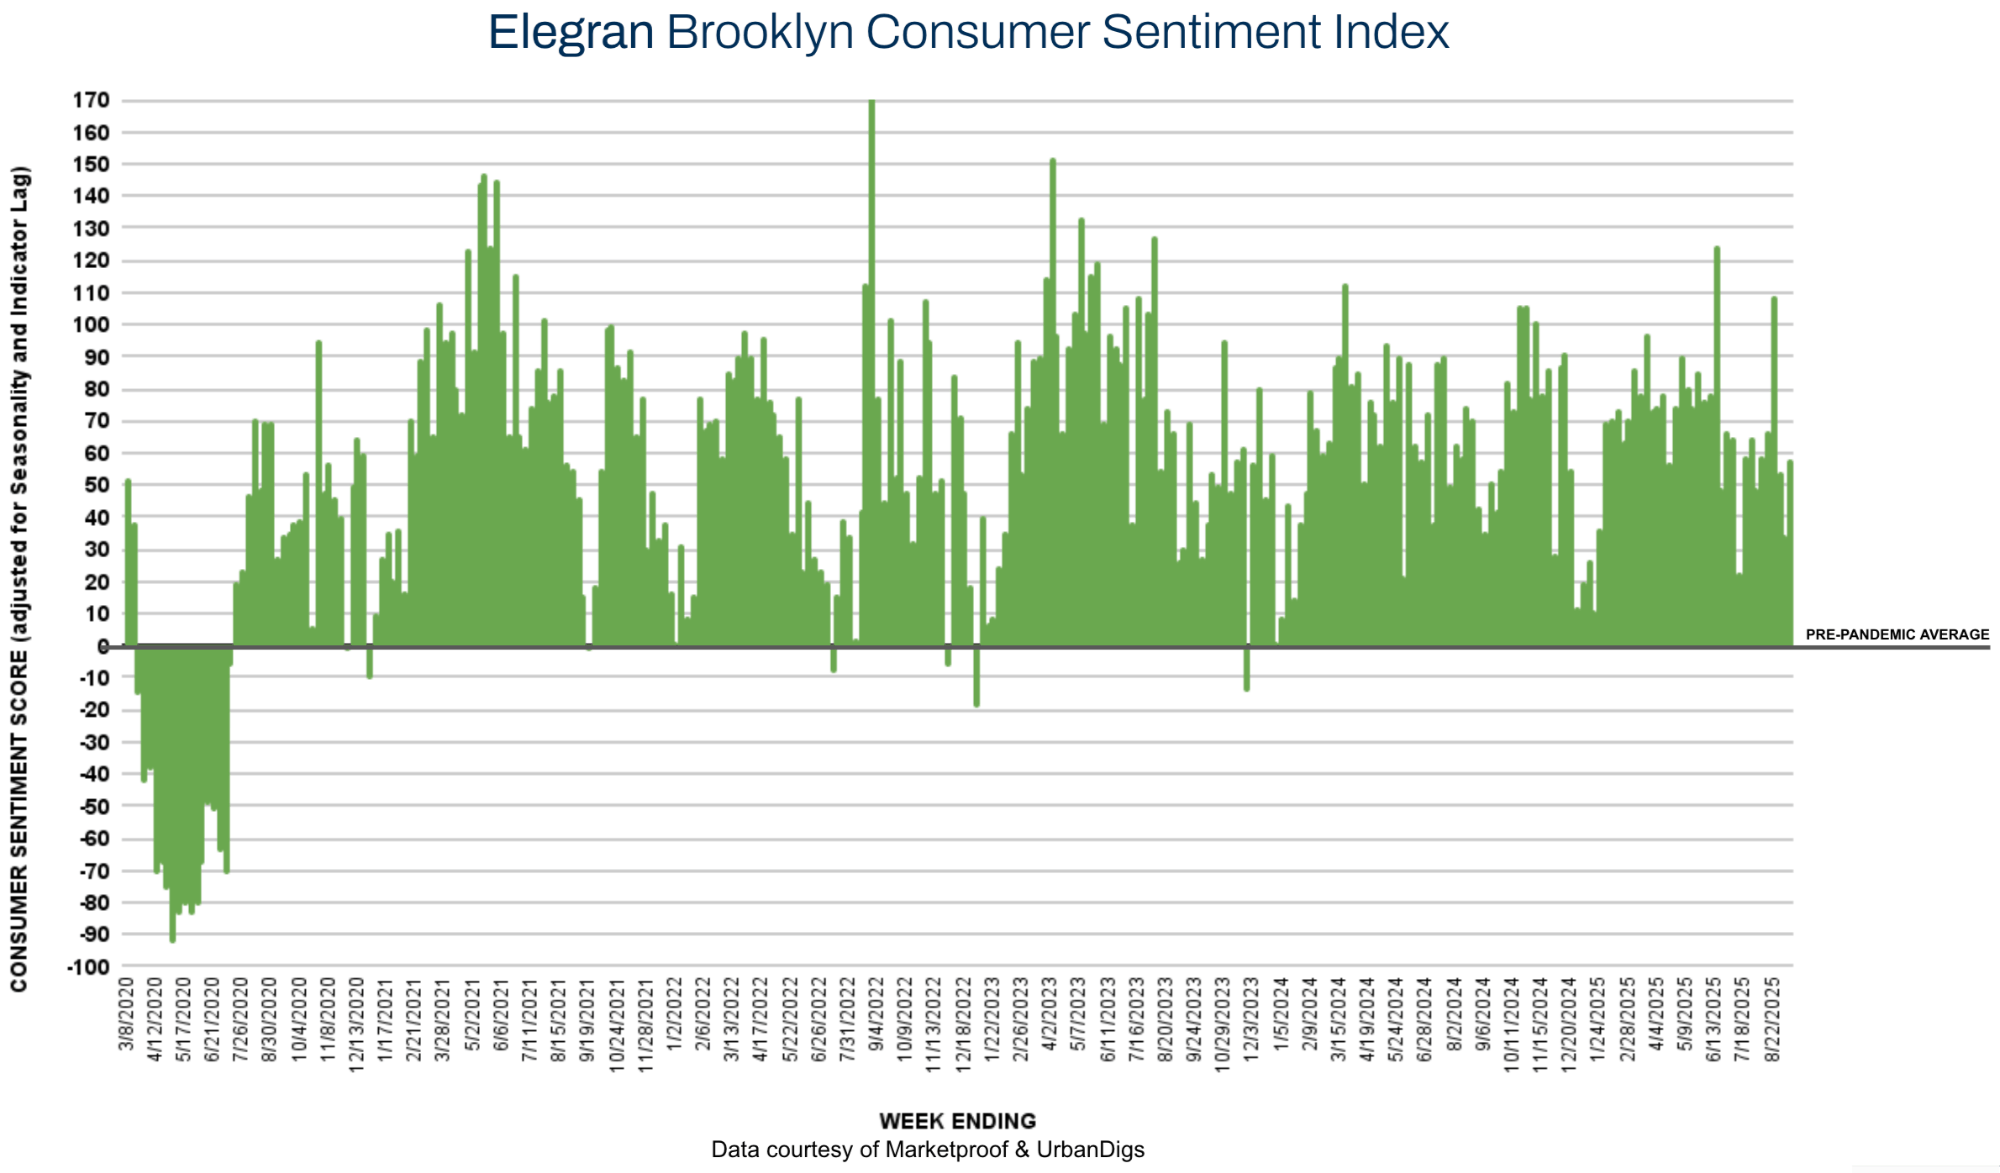
Brooklyn bucked the Manhattan trend, with 114 contracts signed (+21% WoW, +5% YoY). The Elegran Brooklyn Consumer Sentiment Index climbed from +34% to +57%, signaling strong buyer confidence. With new listings building momentum, Brooklyn’s market appears well-positioned heading into the fall.
Marketproof reported that 18 new development contracts were signed in 17 buildings this week. The following buildings were the top-selling new developments of the week:
Her experience, expertise, and engaging personality make Sonal the perfect combination of advisor, advocate, and strategist. She is the proud owner of several NYC properties and a skilled negotiator with a deep understanding of people and sharp instincts about market trends.